- Gold rallies 7% in a week on the back of weak US data
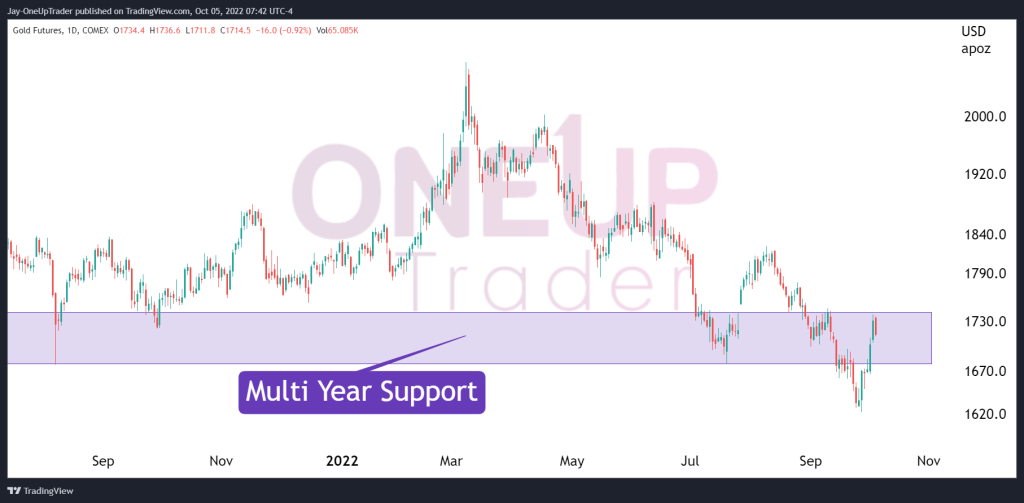
- Prices Rally back inside a multi-year support zone
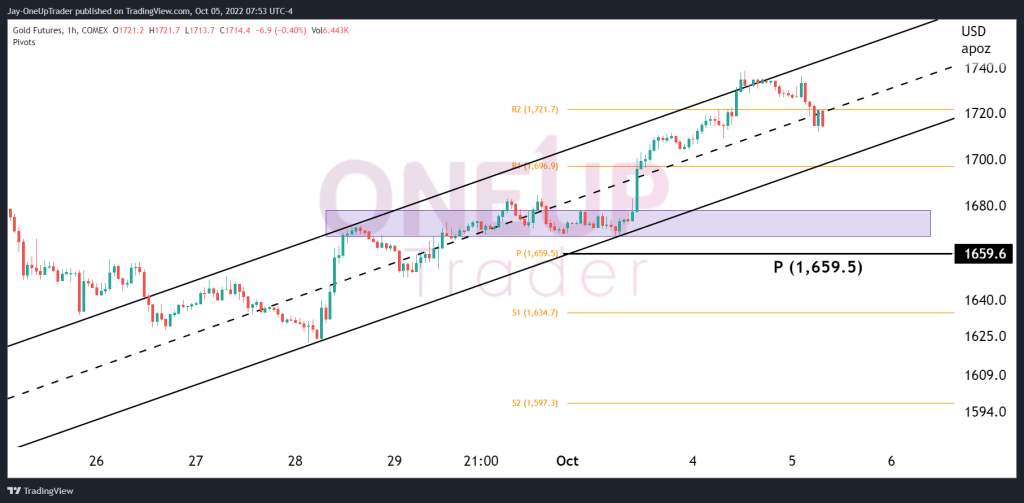
- Pivot Points give potential turning points on shorter time frames
Gold Rallies On Back Of Weak US Data and Dollar
Gold prices rallied over 7% within a week as the US reported weaker data causing the Dollar to lose some strength. There has also been pushback on the Feds policy as the UN has urged them to halt the rate hikes in fear of causing an economic crisis.
Gold has rallied intensely above the multi-year support level that we have been monitoring. In last week’s article, we saw that price had broken to the downside, and the slide likely would have continued if it wasn’t for the weak US data and rumored slowdown in rate hikes. This is why it’s vital for traders today to be able to switch positions or outlooks at the drop of a hat. Volatility and wild swings in price are likely to occur because of the market’s tremendous dependency on the Fed.
Pivot Points On Shorter Time Frames
If we open an hourly chart, the pivot points give us a few potential turning points we can monitor. At this point, we do not have clarification on the Fed’s stance, so we must be cautious in how much risk we are willing to put on. The pivot point is at $1,659.5, which could be an excellent area to accumulate if the trader has a bullish outlook. Pivot points are calculated on the previous trading days’ price data. You can learn more about them in the video we posted here.
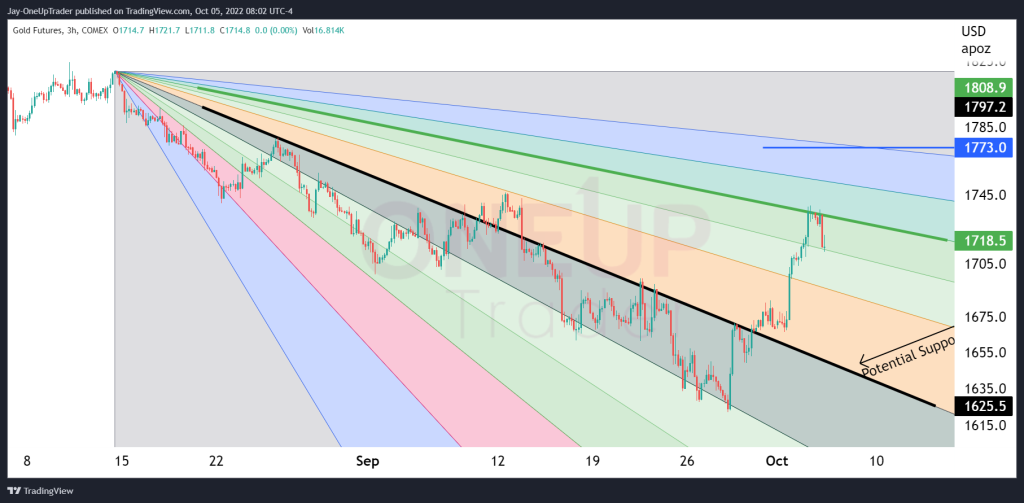
Fibonacci Fan Analysis
As gold rallied, it found resistance off the 50% price level for the fan. Look how strictly price respected that level. The Fibonacci fan predicts support and resistance levels on a chart once we anchor two points together, usually two swings, just like we would if we were connecting a trend line. The fan has zones too that we can trade within, the color changes between each zone help us to identify them easily, and as the price moves into each zone, the Fib line above should act as resistance while the line below should act as support.
If there is a slight drop in the Gold price, we suspect there to be some support at the 0% Fib line highlighted with the thick black line in the chart below. A rally above the 50% level could send the price to $1773.0