

Introduction
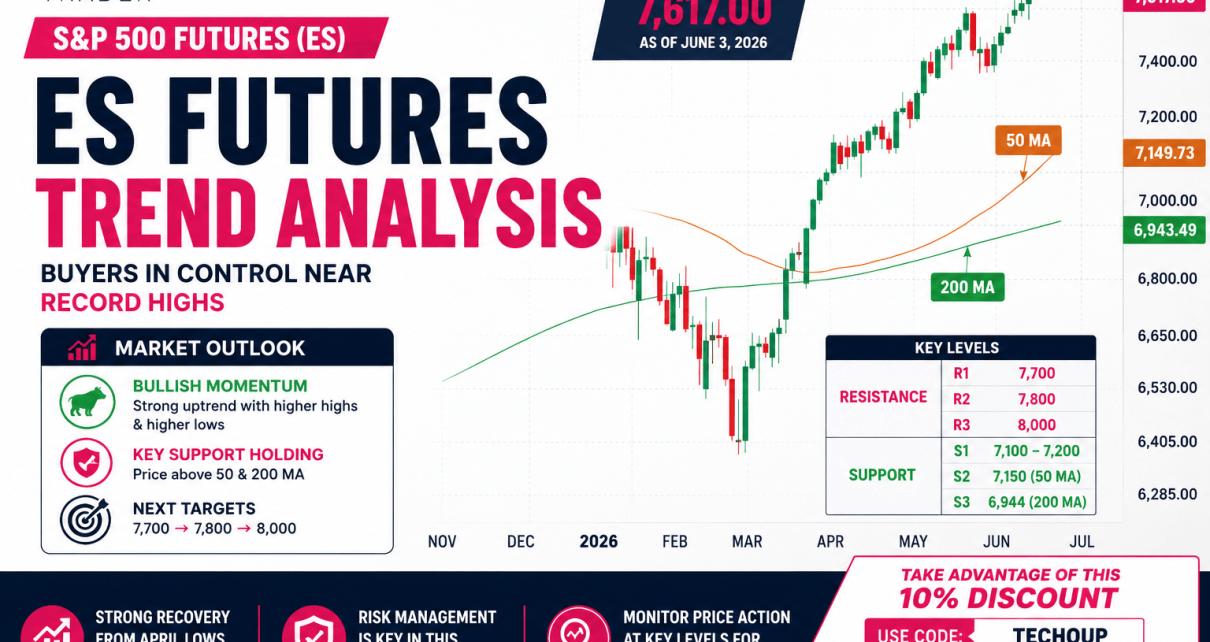
S&P 500 futures continue trading near record highs following the breakout structure we discussed in our previous analysis. Since then, ES has pushed higher from the 7,529 area and is now trading around 7,617 as buyers continue defending every minor pullback.
In our last report, we saw MACD forming a bearish divergence, but there has been no follow-through on that. In fact price has continued higher as the bulls continue to dominate. It is a very difficult market for short sellers right now.
Lets look at the technicals and see what they are telling us.
ES Futures Trend Analysis
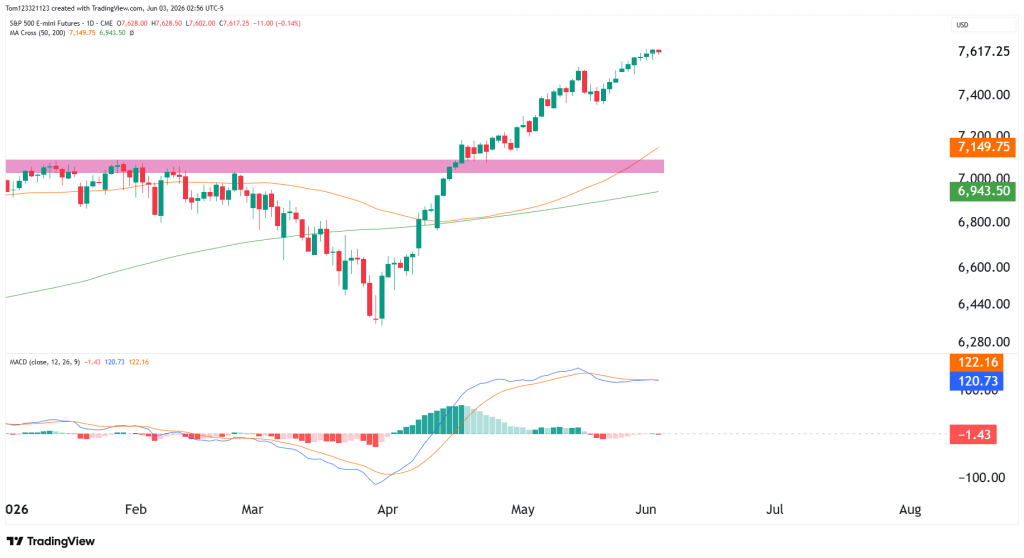
Since the April low near 6,400, ES has produced one of the strongest recoveries among major global equity indices. Buyers continue to maintain higher highs and higher lows while keeping price well above both key moving averages. Every small pullback is getting bid back up as we can see in the video below.
Risk Management In This Market
As traders, we know how important risk management is, especially in a funded trader program. Short sellers are going to be fighting the trend all along because it doesn’t look like the buying power is slowing down any time soon.
It is important to monitor risk closely for both long and short traders now because the market is slightly extended and chasing it up can be risky if the correct stop placement is not taken. Short sellers need to be careful of trying to catch the top of each move because any trades taken in that direction now are direct counter-trend trading positions.
Estimated Probabilities for ES Futures
| Scenario | Estimated Probability | Market Interpretation |
|---|---|---|
| Continued breakout toward 7,700 | 55% | Buyers maintain control and extend the trend |
| Consolidation above 7,200 support | 35% | ES pauses while preserving bullish structure |
| Pullback toward the 50-day moving average | 10% | Momentum weakens and triggers a deeper retracement |
Key Support and Resistance Levels
Major Resistance Levels
- 7,700
- 7,800
- 8,000
Major Support Levels
- 7,100–7,200 breakout zone
- 7,150 (50-day moving average)
- 6,944 (200-day moving average)
ES Possible Trades
Bullish Continuation Trade
The primary trend remains higher. As long as ES continues holding above the previous breakout zone, buyers maintain control of the market. A sustained move above recent highs could open the door for a push toward the 7,700 region.
Consolidation Trade Setup
The market has spent the last several sessions digesting gains near the highs. If ES continues moving sideways while holding above support, it would likely reinforce the current bullish structure and allow momentum indicators to reset further.
Bearish Rejection Trade
While this remains the lower-probability scenario, traders should continue monitoring the MACD and the 7,200 support zone. A loss of support combined with increasing downside momentum would be the first indication that a larger pullback may be developing.
Take Advantage of This 10% Discount & Start Your Evaluation Today!
This analysis is provided for educational and informational purposes only and should not be considered financial or trading advice. Trading futures, forex, and other leveraged financial instruments carries a high level of risk and may not be suitable for all investors. Past performance is not indicative of future results. Before making any trading decisions, conduct your own research, assess your risk tolerance, and consult with a qualified financial advisor if necessary.
