


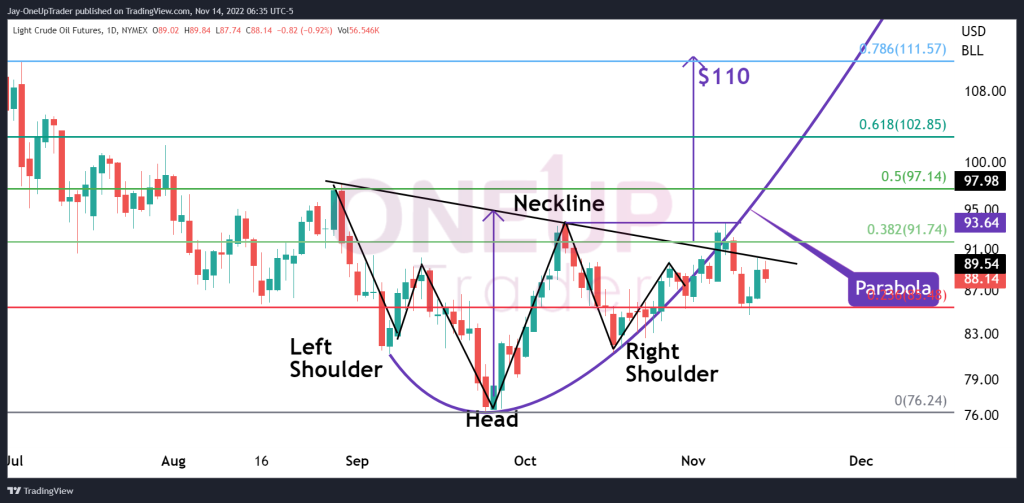
- The Neckline of the Inverse Head & Shoulders pattern Daily chart is tested.
- Fibonacci targets revisited from last week.
- Price zones to keep in mind while trading today’s session.
Quick Recap
In our analysis from last week, the Head & Shoulders and Parabola were the main focus. CL price has broken the Parabola, which signals could signal that the bullish momentum is slowing. However, the inverse Head and Shoulders remain intact as the price tests the Neckline. The Neckline is around $89.54, and the CL price is $88.14 at the time of writing.
Fibonacci Retracements
The Fibonacci retracements in our last article remain the same; The 50% level at $97.14 could be the next target for bulls. The 61% and 78% levels are at $102 and $110, respectively, which is the main target for the Head & Shoulders pattern.
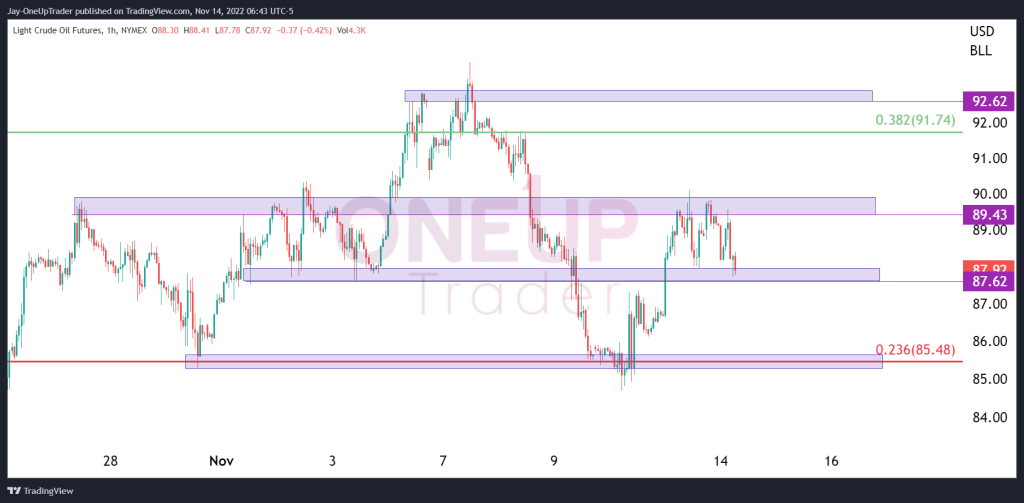
Key Price Zones On The Hourly Chart
There are a few price zones on the chart below that traders can keep an eye on. Zones are excellent ways to view supply and demand on a chart. The current price of CL is trading within the zone at around 87.62. A break out below the current zone could send prices lower to the zone around $85.48, which is the next immediate target and also the 23% Fibonacci level.
The zone above $89.43 is the closest to current prices and has been rejected three times in the most recent move. A breakout above that zone would mean targets of $92.62 are in play and would give the inverse Head & Shoulders a higher probability of playing out.


