



Introduction
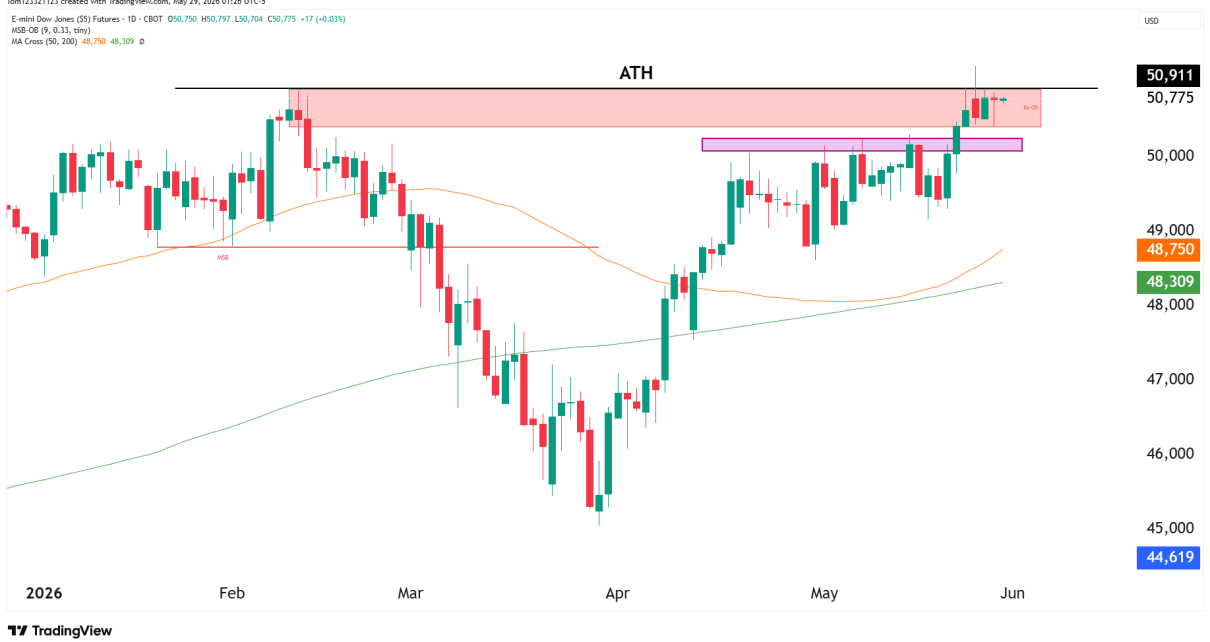
Dow Jones futures continue testing the record highs after successfully breaking above the previous all-time high earlier this week. In our last analysis, we highlighted the importance of the 50,900 level as buyers attempted to push into price discovery. Since then, YM has done that, but has not broken through with conviction.
The current daily chart shows Dow futures trading around 50,775. This is just below the previous ATH, and now that we are moving into the weekend, today’s session will be an important one and set the tone for the start of next week. If we see a red candle, it brings in slightly more doubt to the market but if we see a green day, it could give the bulls more confidence to buy up at the start of next week.
Dow Jones Futures Trend Analysis
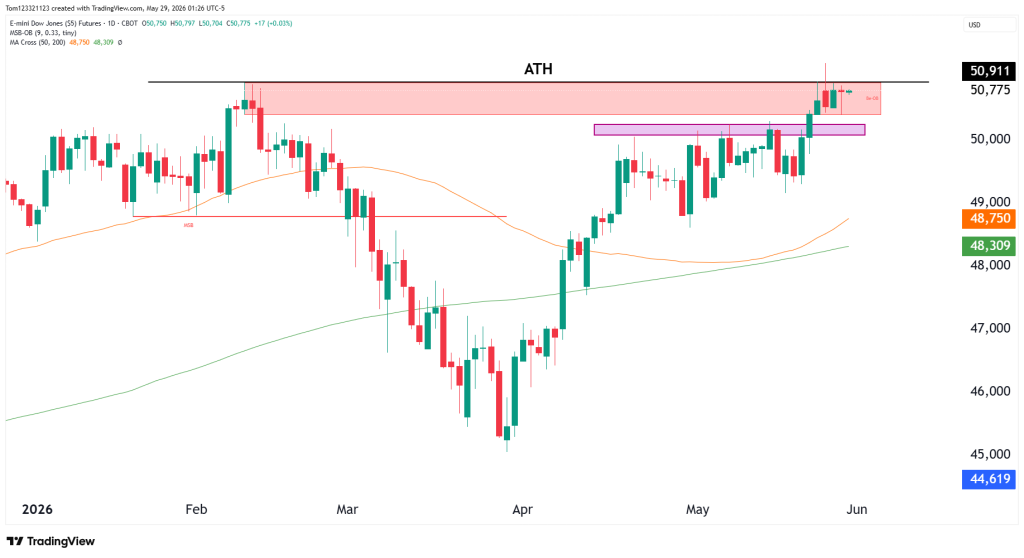
Current technicals show:
- The 50-day moving average near 48,750
- The 200-day moving average near 48,309
- Current price trading around 50,775
- Previous all-time high near 50,900 now acting as support
- Major support zone near 50,000–50,200
One of the most important developments on the chart is the successful breakout and retest of the previous all-time high. Rather than immediately falling back below resistance, price has spent the past several sessions consolidating near the highs. This type of behavior is often seen when markets pause before deciding whether to continue trending higher.
Breakout Still Intact
Although the market has not accelerated higher immediately after the breakout, there are currently few signs of aggressive selling pressure. The recent candles show a balance between buyers and sellers, but importantly, sellers have not been able to force price back below the breakout level.
As long as YM continues holding above the former all-time high region, the breakout remains valid and the trend remains bullish.
A decisive move back above the recent highs could signal the next leg higher as buyers continue pushing into price discovery territory.
Estimated Probabilities for Dow Jones Futures
| Scenario | Estimated Probability | Market Interpretation |
|---|---|---|
| Continued breakout toward 51,500–52,000 | 55% | Buyers maintain control above ATH support |
| Consolidation above 50,000 support | 30% | Market pauses while preserving bullish structure |
| Failed breakout below 50,000 | 15% | Sellers regain momentum and trigger deeper pullback |
Key Support and Resistance Levels
Major Resistance Levels
- 50,900–51,100
- 51,500
- 52,000
Major Support Levels
- 50,000–50,200
- 48,750 (50-day moving average)
- 48,309 (200-day moving average)
Dow Jones Futures Possible Trades
Bullish Continuation Trade
As long as Dow futures remain above the previous breakout area, buyers continue holding the advantage. A move back through recent highs could attract additional momentum and potentially open the door toward the 51,500 and 52,000 regions.
Pullback Trade Setup
If YM pulls back toward the 50,000–50,200 support zone and buyers continue defending that area, the broader bullish structure would remain intact.
Failed Breakout Scenario
While this remains the lower-probability outcome, traders should continue watching the 50,000 level closely.
Start Your Evaluation With OneUp Trader Today
This analysis is provided for educational and informational purposes only and should not be considered financial or trading advice. Trading futures, forex, and other leveraged financial instruments carries a high level of risk and may not be suitable for all investors. Past performance is not indicative of future results. Before making any trading decisions, conduct your own research, assess your risk tolerance, and consult with a qualified financial advisor if necessary.