

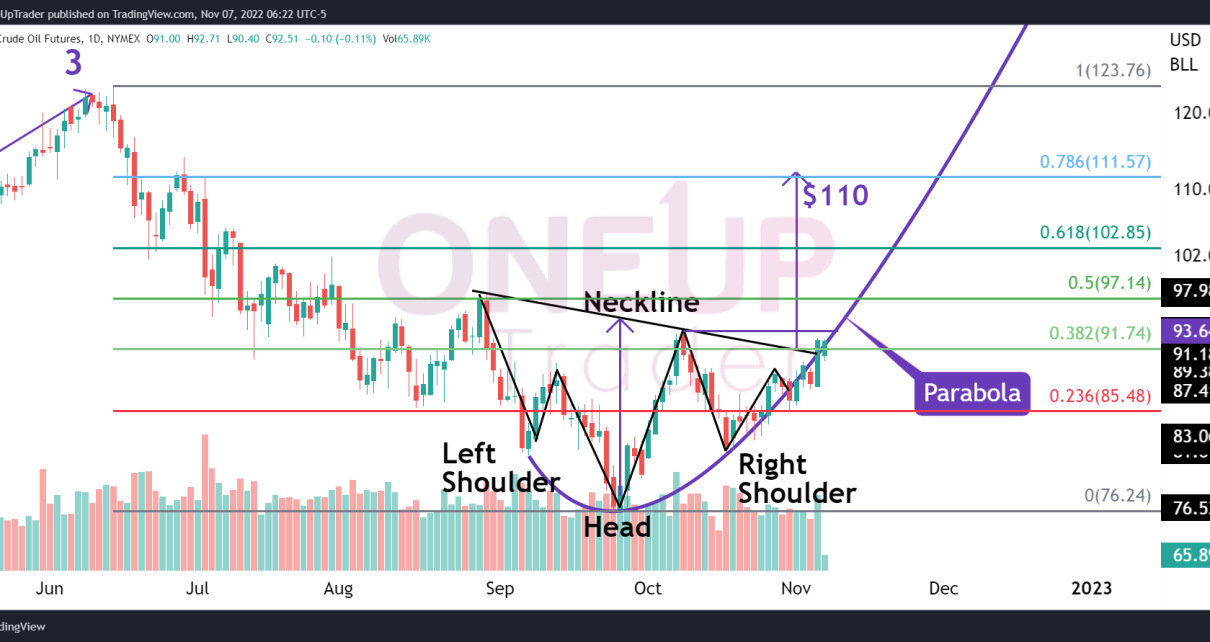
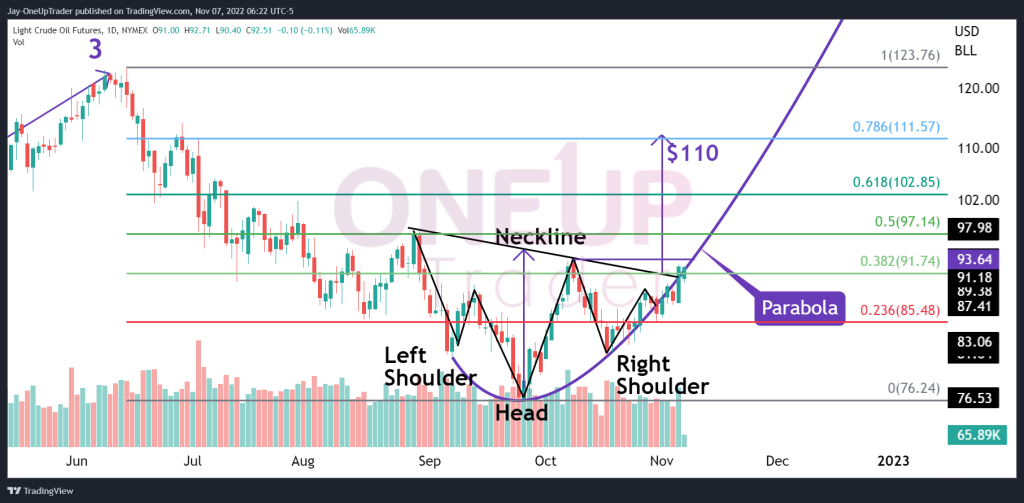
- CL prices continue to follow the Parabola.
- The Inverse Head & Shoulders pattern has a chance as the price hovers above the neckline.
- Technicals point toward a bullish sentiment.
- Fibonacci analysis and targets if the rally continues.
Quick Recap
In the previous two articles, the central theme has been the bullish sentiment of CL, mainly driven by the bullish parabolic curve we analyzed. The first bullish target of $90 was hit last week, with the price just 1% away from the second target of $93.64. Take a look at our previous two articles here and here to keep updated with what we are watching in the CL price.
Bullish Sentiment Continues
As the Parabola continues to guide the CL price higher, there are a few things we can direct our focus towards. The Inverse Head & Shoulders, Fibonacci targets, and bullish candlestick formations.
Inverse Head & Shoulders
The CL price is hovering above the neckline of the H&S pattern formed on the Daily chart. If the breakout is confirmed, we may see a strong price move up. Measuring the head to the neckline gives the pattern a target of $110, which coincides with the 78% Fibonacci level.
Fibonacci Retracements
The Fibonacci retracements have been measured from the June 14th high to the September 27th low. The 50% level at $97.14 could be the next target for bulls. The 61% and 78% levels are at $102 and $110 respectively, which is the main target for the Head & Shoulders pattern.
Bullish Candlestick Formations
The daily chart has had strong bullish candlestick formations with high volume, the red days have been smaller in comparison to the green days further adding to the bullish sentiment from our other indicators on the CL chart.
Summary
The technicals for Crude Oil look strongly bullish at the moment. The parabolic curve remains the leading force in maintaining that sentiment. In order for the bullish bias to remain valid, we must see CL stay above the 23% Fibonacci level of $85.48, if we see the price fall that low, the Parabola would have been broken and the inverse H&S would have failed which would require us to re-evaluate our stance.

