

Introduction
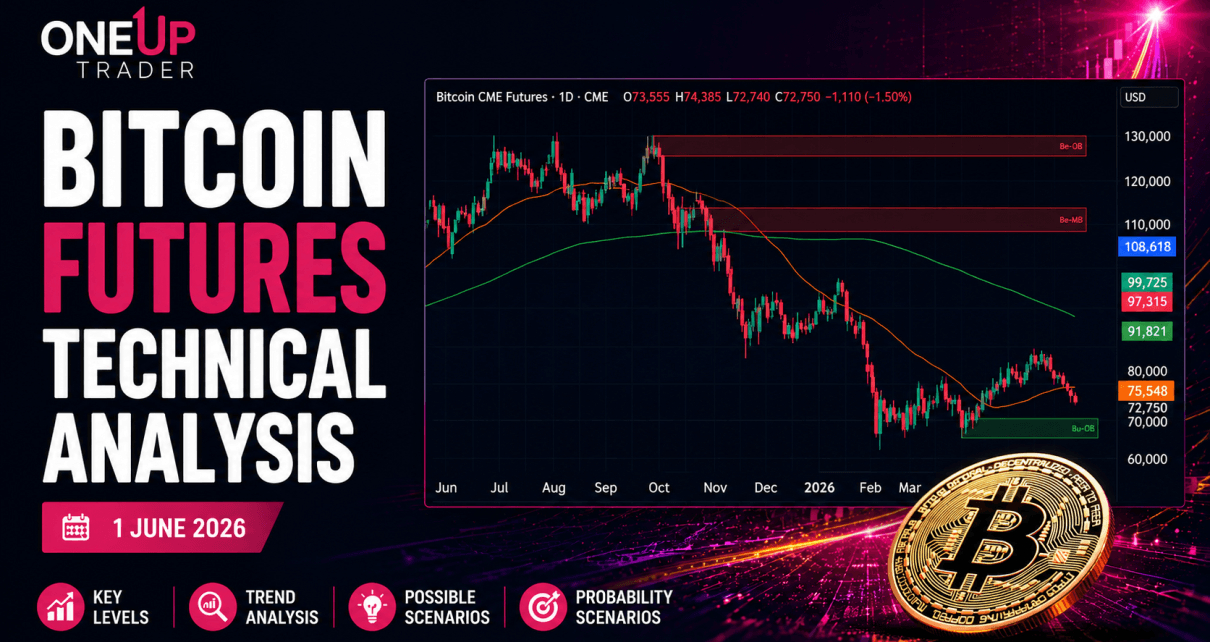
Bitcoin has entered an important phase after a sharp correction from the 2025 highs. Following an explosive rally that pushed Bitcoin above $120,000, sellers have regained control during the first half of 2026, driving prices back toward the mid-$70,000 region.
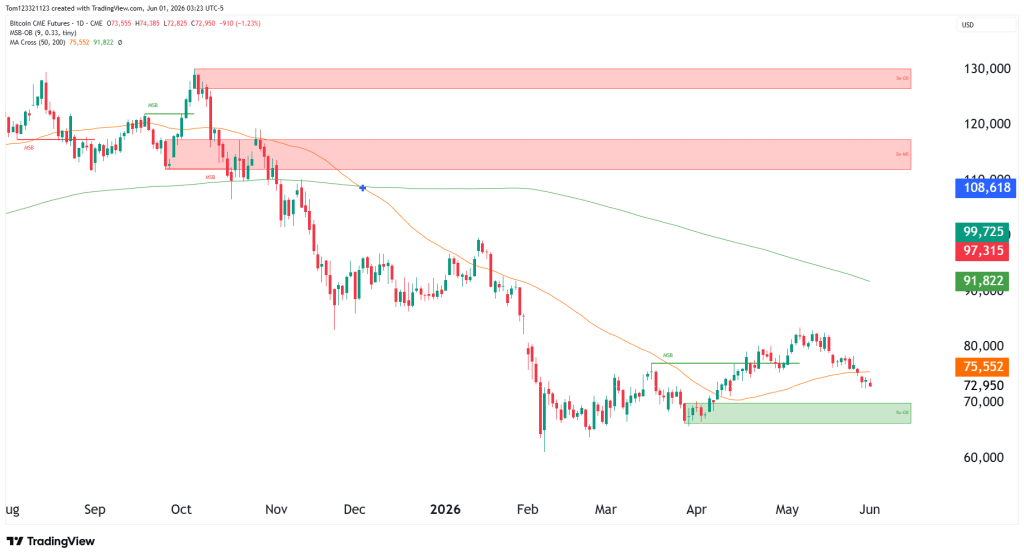
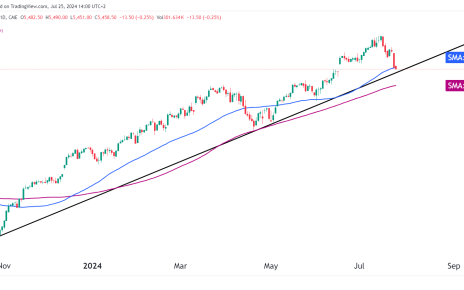
The current daily Bitcoin chart is sitting around $73,000 after failing to hold above the 50-day moving average on its first test since breaking above it back in April. While the long-term bull market structure remains intact, short-term momentum has clearly shifted in favor of sellers as Bitcoin continues forming lower highs and lower lows. Though it can also be looked at as a consolidation period in the longer-term trend.
Price is approaching a very important support zone just below $70K. This level, if held, could be the springboard bulls need to get a new rally going. This zone is vital because if it doesn’t hold, we could see Bitcoin go into a free fall where support could come in only around $50,000.
Bitcoin Futures Trend Analysis
Bitcoin remains one of the most volatile markets in the world, and the current correction highlights how quickly sentiment can change after a major rally.
Is Bitcoin Entering a Larger Correction?
The current structure leans us toward thinking Bitcoin may still be working through a bigger corrective phase. With the halving coming in 2028, the market normally already falls after its bear trend before the halving, and then the rally comes with a new high in the digital currency. Will this happen again? Could it mean the low is already in for BTC then and now is the time to accumulate?
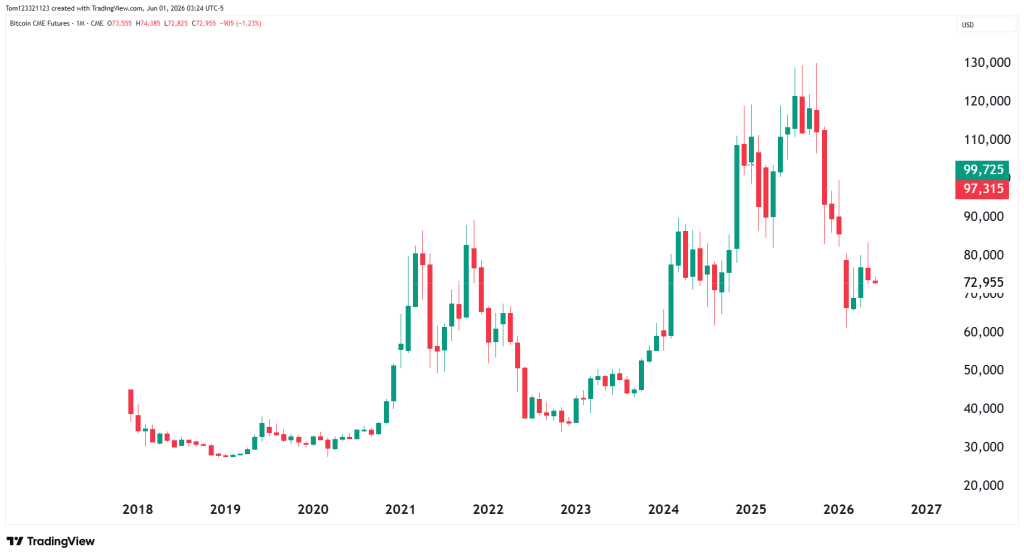
For long-term investors, this correction may look relatively normal compared to previous Bitcoin cycles. However, from a shorter-term trading perspective, momentum remains bearish until buyers can reclaim at least the 200 moving average.
The $66,000–$70,000 support zone stands out as one of the most important areas on the chart. This region has attracted buyers several times during 2026 and could once again become a battleground between bulls and bears.
Estimated Probabilities for Bitcoin Futures
| Scenario | Estimated Probability | Market Interpretation |
|---|---|---|
| Retest of $66,000 support zone | 45% | Sellers maintain short-term control |
| Consolidation between $70,000 and $80,000 | 35% | Market stabilizes after recent decline |
| Recovery above $80,000 and 50-day MA | 20% | Buyers regain momentum |
Key Support and Resistance Levels
Major Resistance Levels
- $75,500 (50-day moving average)
- $80,000
- $110,000–$115,000
Major Support Levels
- $70,000
- $66,000
- $60,000
Start Your Evaluation With OneUp Trader Today!
Frequently Asked Questions
Is Bitcoin bullish or bearish right now?
Bitcoin remains bearish in the short term after falling below its 50-day moving average. However, the long-term trend remains intact while price stays above major support levels.
What is the next support level for Bitcoin?
The next major support zone sits between $66,000 and $70,000. This area has attracted buyers several times throughout 2026.
Can Bitcoin recover above $100,000?
A recovery remains possible, but buyers would first need to reclaim the $75,500 area and establish higher highs before challenging major resistance levels.
What is Bitcoin’s current trend?
The short-term trend remains bearish while the long-term trend remains neutral to bullish.
These FAQ sections often generate featured snippets.