Skip to content
OneUp Trader Blog
Close
  • About Us
    • What Makes Us Different
    • Why Choose OneUp Trader
  • Our Offering
    • Funded Trader Program
    • Pricing
    • How it Works
    • Evaluation Guidance
    • Trading Platform Features
  • Blog
  • Support
    • Get Started
    • FAQ
    • Trading Strategies for Beginners
    • Top Trading Strategies
    • Trading Platforms for Beginners
    • Contact Us
  • Partners
  • Login
START NOW
  • Announcements
  • Technical Analysis
  • Fundamental Analysis
  • Trading Strategies
  • Funded Traders
  • Interviews
  • Home
  • Strategies
  • Page 6
Bear and bull flag pattern
Analysis Strategies

Bear and Bull Flag Pattern Trading

Posted on August 2, 2022August 2, 2022
Fibonacci retracement levels
Strategies Trading Tips

How to Use Fibonacci Retracement Levels

Posted on July 20, 2022July 20, 2022
False breakout candle pattern
Strategies Trading Tips

False Breakout Candle Pattern

Posted on July 6, 2022January 5, 2023
Mr Bond line simple trading strategy
Strategies

Simple Trading Strategy Mr. Bond Lines [VIDEO]

Posted on June 30, 2022January 5, 2023

Strategies

MACD indicator
Strategies Trading Tips

How to Read MACD Indicator – Explained

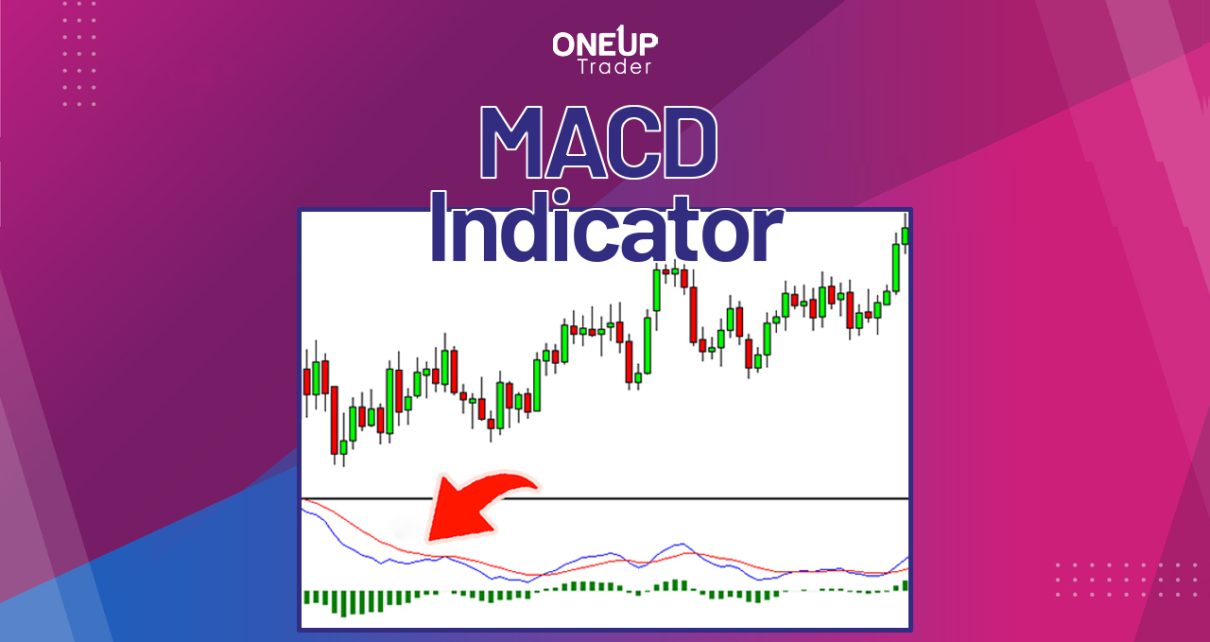
Moving average convergence divergence (MACD) is one of the most versatile technical indicators – it’s both a trend and momentum indicator. The MACD indicator can best be described as a 2-in-1 indicator; it shows the start of a bullish or bearish trend using the MACD crossover and the strength or weakness of a trend with Read More…

Posted on June 28, 2022January 6, 2023 Comment(0)
Rising and falling wedge chart pattern trading
Strategies Trading Tips

Rising and Falling Wedge Chart Pattern Trading

Any price action has a series of steady bullish and bearish trends punctuated by momentary price consolidation. When timed accurately, breakout trading strategies can be invaluable for catching trends while they’re just beginning. And this is what the rising and falling wedge chart pattern trading is geared towards.  What are Wedge Chart Patterns? A wedge Read More…

Posted on June 16, 2022January 6, 2023 Comment(0)
Head and Shoulders Chart Pattern
Strategies Trading Tips

Head and Shoulders Chart Pattern Trading

Technical indicators have always been faulted for lagging, making price action analysis invaluable to any trader. With hundreds of chart patterns to choose from, it may not be easy to decide which one is more reliable and suited to your trading style. However, it’s a general consensus that the ideal ones should generally be easy Read More…

Posted on June 6, 2022January 6, 2023 Comment(0)
Dark cloud cover
Strategies

Dark Cloud Cover Pattern [VIDEO]

The Dark Cloud Cover is a candlestick pattern identifying bearish market reversals. The pattern is easy to spot and analyze, and you can use it as a signal to enter short positions or exit long positions. This guide will talk about what Dark Cloud Cover is and the Dark Cloud Cover scalping strategy. Scroll down Read More…

Posted on May 17, 2022January 6, 2023 Comment(0)
Strategies Trading Tips

Double Top and Bottom Chart Patterns in Trading

In technical analysis, double top and bottom are chart patterns that predict market trends. Hence, it is not uncommon to find double tops and bottoms on the charts of financial instruments.  Double tops signify the end of a bullish trend, whereas double bottoms indicate a possible bearish trend reversal. Chart patterns such as double tops Read More…

Posted on April 21, 2022January 6, 2023 Comment(0)
Fibonacci moving averages
Strategies

Fibonacci Moving Averages & RSI Trading Strategy

This guide will talk about the Fibonacci Moving Averages with the RSI indicator on the Light Crude Oil Futures. We all know that market phases are cyclical. They increase, peak, drop, and fall to their lowest point. The end of one market cycle signals the start of the next. So, to make better use of Read More…

Posted on March 23, 2022May 17, 2022 Comment(0)

Posts pagination

Previous 1 … 5 6 7 … 11 Next

Get Funded: Pass the evaluation and get placed with our funding partner!

Start Now
Track all markets on TradingView

Recent Posts

  • Dow Jones Futures Technical Analysis: 5 June 2026
  • Crude Oil Futures Technical Analysis: 5 June 2026
  • US Interest Futures Reprice Toward Policy Tightening, Eyes on NFP
  • Funded Trader Program: 10-Step Checklist to Pass Your Evaluation and Stay Funded
  • Silver Futures Technical Analysis: 4 June 2026

Archives

  • June 2026
  • May 2026
  • April 2026
  • March 2026
  • February 2026
  • January 2026
  • December 2025
  • November 2025
  • October 2025
  • September 2025
  • August 2025
  • July 2025
  • June 2025
  • May 2025
  • April 2025
  • March 2025
  • February 2025
  • January 2025
  • December 2024
  • November 2024
  • October 2024
  • September 2024
  • August 2024
  • July 2024
  • June 2024
  • May 2024
  • April 2024
  • March 2024
  • February 2024
  • January 2024
  • December 2023
  • November 2023
  • October 2023
  • September 2023
  • August 2023
  • July 2023
  • June 2023
  • May 2023
  • April 2023
  • March 2023
  • February 2023
  • January 2023
  • December 2022
  • November 2022
  • October 2022
  • September 2022
  • August 2022
  • July 2022
  • June 2022
  • May 2022
  • April 2022
  • March 2022
  • February 2022
  • January 2022
  • December 2021
  • November 2021
  • October 2021
  • September 2021
  • August 2021
  • July 2021
  • June 2021
  • May 2021
  • April 2021
  • March 2021
  • February 2021
  • January 2021
  • December 2020
  • November 2020
  • October 2020
  • September 2020
  • August 2020
  • July 2020
  • June 2020
  • May 2020

Categories

  • Analysis
  • Announcements
  • Economics
  • Fundamental Analysis
  • Funded Traders
  • Funded Trading
  • Interviews
  • Market Overview
  • Strategies
  • Technical Analysis
  • Trading Psychology
  • Trading Tips
  • Uncategorized
  • Withdrawals

Now what?

  • Announcements
  • Technical Analysis
  • Fundamental Analysis
  • Trading Strategies
  • Funded Traders
  • Interviews

OneUp Trader

  • About Us
  • How it Works
  • FAQ
  • Contact Us
  • Affiliate Program
  • Trader Login
  • Sign Up

Popular Questions

  • How to Become a Funded Trader?
  • What Accounts Do You Offer?
  • What Are the Evaluation Rules?
  • What Trading Platforms Can I Use?
  • What Instruments Can I Trade?
  • What If I Don’t Do Well?
  • What are the Withdrawal Details?
  • Funded Traders Success Stories

© 2026 OneUp Trader. All rights reserved. Terms | Privacy | Affiliate Partners

All product names, logos, and brands are property of their respective owners. All company, product and service names used in this website are for identification purposes only. Use of these names, logos, and brands does not imply endorsement.

Full Risk Disclosure: Futures trading contains substantial risk and is not for every investor. An investor could potentially lose all or more than the initial investment. Risk capital is money that can be lost without jeopardizing ones’ financial security or life style. Only risk capital should be used for trading and only those with sufficient risk capital should consider trading. Past performance is not necessarily indicative of future results.

CFTC rule 4.41: Hypothetical or simulated performance results have certain limitations. Unlike an actual performance record, simulated results do not represent actual trading. Also, since the trades have not been executed, the results may have under-or-over compensated for the impact, if any, of certain market factors, such as lack of liquidity. Simulated trading programs in general are also subject to the fact that they are designed with the benefit of hindsight. No representation is being made that any account will or is likely to achieve profit or losses similar to those shown.

Copyright © 2026 OneUp Trader Blog. All rights reserved.