

Breakout trading is the cornerstone of most technical indicators. It’s usually the simplest way to gauge the magnitude of a trend. And regardless of your trading strategy, you’re bound to experience some false breakouts, which will kill your strategy. So, how do you avoid false breakouts? And more importantly, how do you take advantage of the false breakout candle pattern?
These two questions will be the focus of this guide.
What is a False Breakout Candle Pattern?
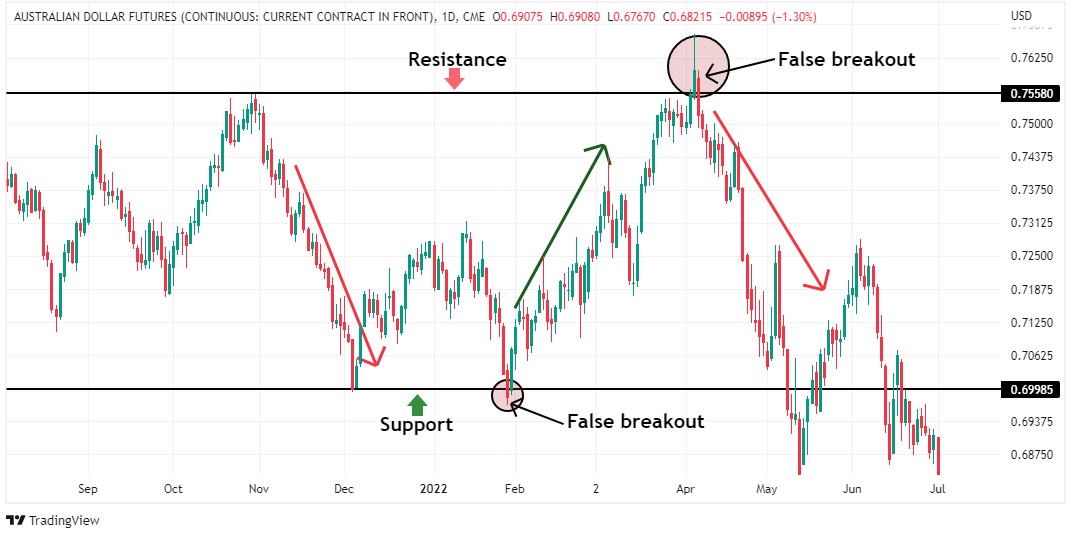
A false breakout occurs when the price breaks above a resistance or below a support level but doesn’t have enough momentum to continue with the trend. In these instances, the price breaks through these levels but suddenly reverses its trend.
The simplest way to identify a false breakout is using the false breakout candle pattern. In most cases, false breakout candles are usually reversal candlesticks or candlestick patterns such as Doji, hammer, shooting star, hanging man, engulfing candlestick pattern, Harami, etc.
Typically, a false breakout candle pattern can occur at horizontal support or resistance levels, around a psychological price level, at trend lines, Fibonacci levels, triangles, or any other chart pattern.
Generally, breakout trading strategies rely on the price breaching the support or resistance and proceeding to form new trends. But with false breakouts, there aren’t enough bulls or bears in the market to continue pushing the price. They lead to reversals resulting in bull and bear traps forcing the liquidation of traders who were long or short. These are the two types of false breakouts – bull trap and bear trap. We’ll discuss these two later on.
How to Identify a False Breakout Candle Pattern
Admittedly, it’s impossible to know in advance whether the level will be broken out or not. This is where the importance of volume analysis comes in. Usually, a breakout is followed by an increase in the volume traded. However, when the volume traded decreases during a breakout, it shows that the breakout trend is weakening.
While some false breakouts tend to be almost instant, most aren’t. In most cases, the initial breakout is followed by an accumulation phase. This is where the 3% rule comes in handy. To confirm whether a breakout is true, check if the price progresses at least 3% from the support or resistance.
False Breakout Candle Pattern Trading
As we’ve mentioned, false breakouts often lead to reversal trends, which means we can anticipate two possible trading scenarios. Firstly, a false breakout occurs in an uptrend because there aren’t enough bulls to continue pushing the price higher. And secondly, in a downtrend, a false breakout occurs when there aren’t enough bears to keep pushing the prices lower. Both scenarios lead to bull trap and bear trap, respectively.
Ideally, the best way to trade a false breakout candle pattern is to align it with the longer-term dominant trend. For example, if you’re on a 1-hour chart and you observe a false breakout candle pattern, check whether the potential reversal due to the false breakout aligns with the trend on a larger timeframe, say, the 4-hour or daily chart.
Trading the Bull Trap
A bull trap is a false breakout formed in an uptrend; the price crosses above the resistance and pulls back after a short while.
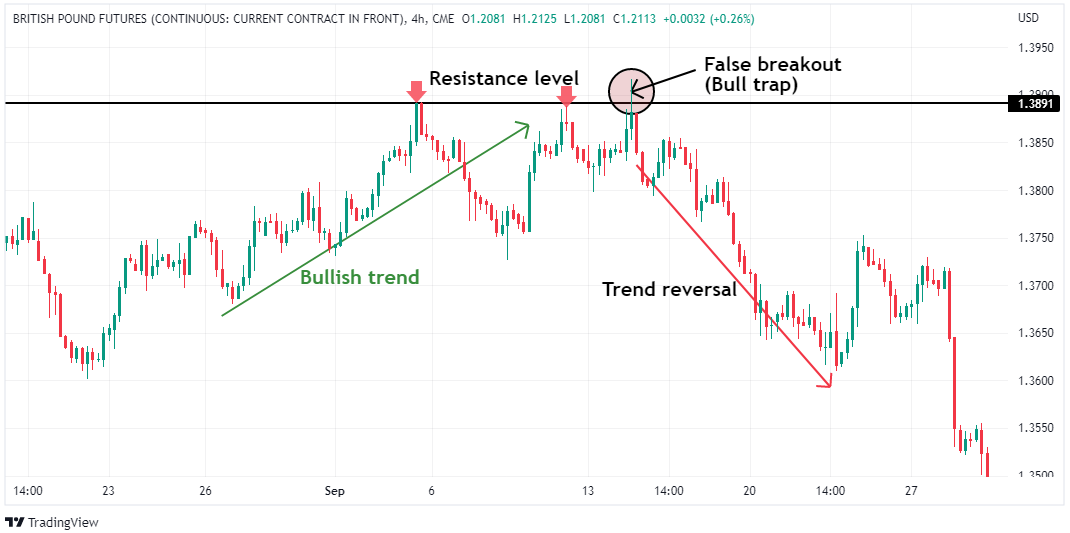
Here’s the logic behind a bull trap. When the initial bullish breakout happens, most traders prematurely open long positions. However, a sudden market reversal leads to unexpected losses, forcing them to liquidate or remain trapped in their long positions. A combination of bullish traders exiting their positions and new traders taking short positions further pushes the price down, solidifying the downtrend.
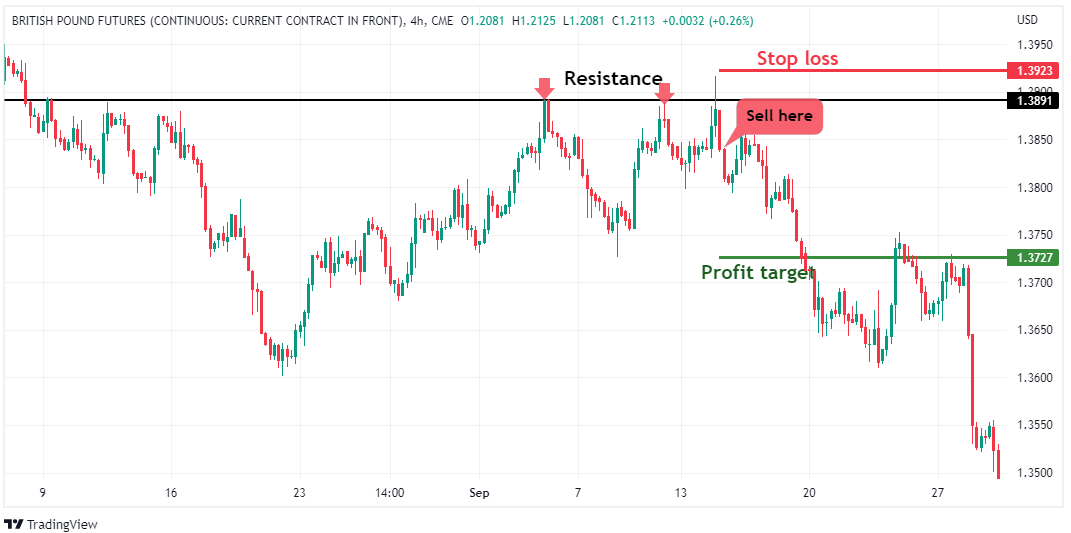
The ideal entry point for short-selling in a bull trap depends on two conditions. Firstly, the price must break above the resistance but immediately retrace below it. Preferably, the price should retrace with higher momentum. And secondly, the volume during the breakout should be decreasing. When the price breaches a swing high, but the volume decreases, it indicates that the buying pressure may be weakening compared to the selling pressure.
When these two conditions are met, your short-selling entry should be below the breakout candle. You can set the profit target at the immediate trough before the false breakout, and the stop loss should be above the false break candle.
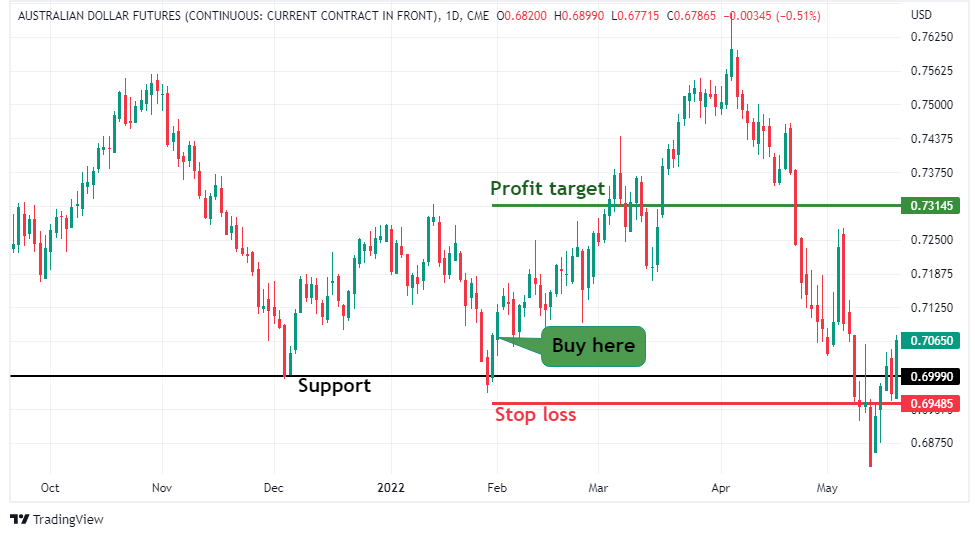
Trading the Bear Trap
A bear trap is a false breakout formed in a downtrend. It occurs when the price drops below the support level and pulls back after a short while.
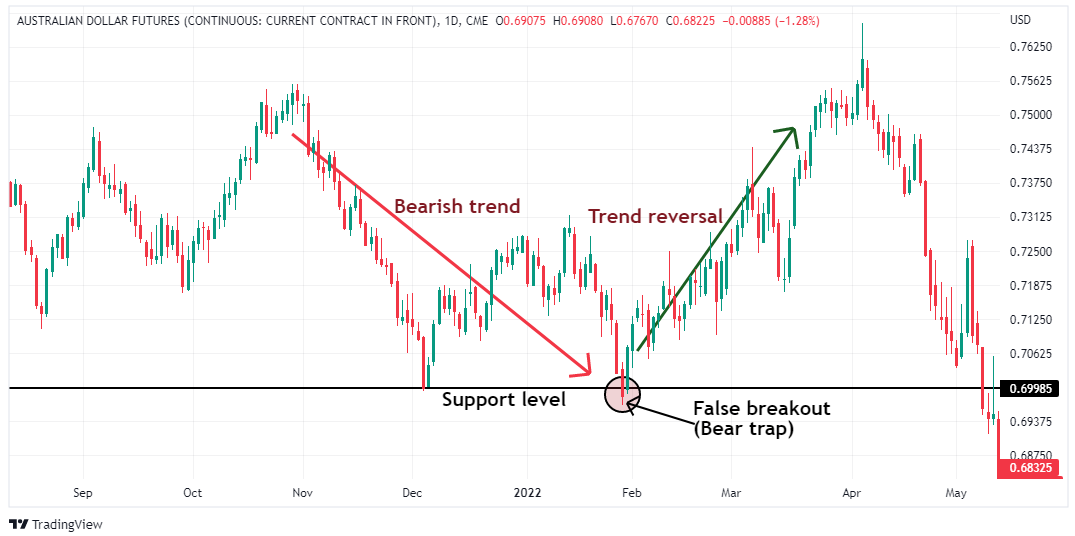
After an initial breakout below the support, most traders prematurely short the market. These traders can either liquidate their positions or be trapped in their short positions after a sharp market reversal. The short-sellers will be forced to buy back the asset to cover their short positions, which, combined with new traders taking long positions, pushes the prices further upwards.
The ideal entry point for buying in a bull trap depends on two conditions. Firstly, the price must drop below the support but, almost immediately, retrace above it. Preferably, the price should retrace with higher momentum. And secondly, the volume traded should be decreasing. When the price breaches a swing low but the volume decreases, it’s a clear indication that the selling pressure is weakening compared to the buying pressure.
When these two conditions are met, the buy entry should be above the breakout candle. And the stop loss should be below the false break candle. You can set the profit target at the immediate peak before the false breakout.
The Bottom Line
Typically, false breakout candle patterns indicate that the initial breakout from the support or resistance level lacks the momentum to continue the trend. They indicate potential trend reversal. When false breakouts occur, they usually lead to bull or bear traps.
A bull trap is a false breakout formed in an uptrend and presents an opportunity to short the market. Conversely, a bear trap is a false breakout formed in a downtrend and presents a buying opportunity. And the simplest way to identify a false breakout is using volume analysis. Real breakouts are often accompanied by large trading volume in the direction of the breakout, but when the volume traded is decreasing during a breakout, it indicates that the breakout trend is weakening.
For more insights about candlestick patterns and charts, read our piece on the most popular candlestick patterns.
