

Moving average convergence divergence (MACD) is one of the most versatile technical indicators – it’s both a trend and momentum indicator. The MACD indicator can best be described as a 2-in-1 indicator; it shows the start of a bullish or bearish trend using the MACD crossover and the strength or weakness of a trend with the MACD histogram.
Let’s take a deep dive into the MACD indicator and see how you can use it in trading.
What is the MACD Indicator?
The MACD indicator has four main components – the signal line, the MACD line, a histogram, and a 0-line.
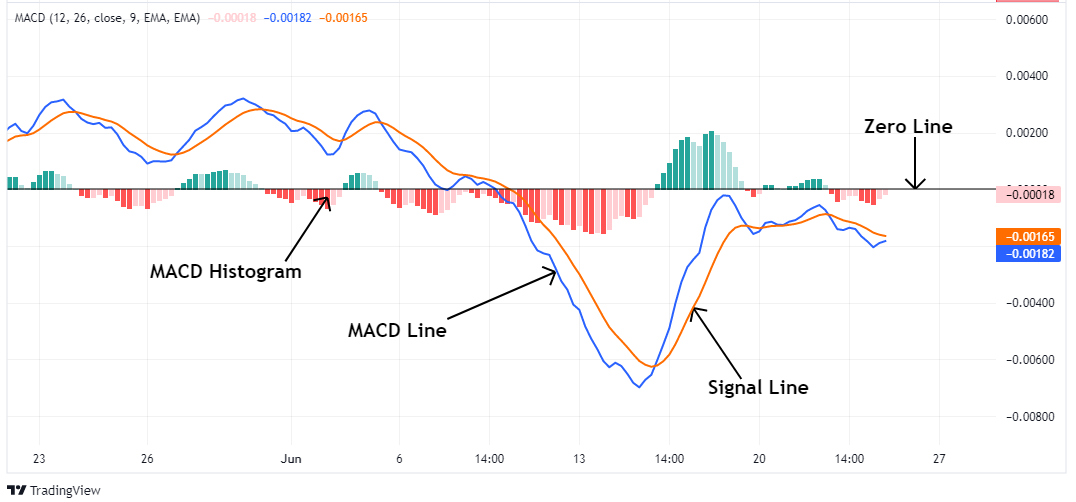
The MACD Line
The MACD line is the difference between two exponential moving averages (EMAs). It is calculated by subtracting the fast EMA from the slow EMA. In this case, the 2-period EMA is the fast EMA, and the 12-period EMA is the slow EMA.
MACD = 12-Period EMA − 26-Period EMA
The MACD line is regarded as the “faster” moving average.
The Signal Line
The signal line is usually a 9-period EMA of the MACD line. This means that the signal line plots the average of the past 9 periods of the MACD line. It’s meant to smooth out the MACD line and is regarded as the indicator’s “slower” moving average.
Generally, the crossover of the MACD line and the signal line is used as a signal of an impending bullish or bearish trend.
The Zero Line
Typically, the MACD line and the signal line oscillate between 1 and -1; and the Zero line lies between these extreme levels.
MACD Histogram
The MACD histogram is the difference between the MACD line and the signal line. It fluctuates up and down the zero line.
Histogram = MACD line – Signal line
Generally, the histogram is used to determine a trend’s momentum. The bullish momentum is strong when the histogram is above the zero line and continues to expand. Conversely, when the histogram drops below the zero line and continues expanding, the bearish momentum is increasing. Note that a shrinking histogram means that the momentum is waning, which could signify a possible trend reversal.
How to Trade Use MACD Indicator
As mentioned, you can use the MACD indicator to determine the trend and its strength. Ideally, there are two ways you can trade with the MACD – the MACD crossover and the MACD divergence. The MACD crossover occurs when the MACD line crosses above or below the signal line.
Ideally, the best MACD setting for day trading will depend on your trading style. You can adjust the MACD settings depending on whether you’re taking short-term or longer-term positions.
When reading a MACD chart, remember that both the MACD line and the signal line are moving averages, and when you have two EMAs with different periods, the faster EMA is more responsive to price changes than the slower EMA. In this case, the MACD line reacts more quickly to price changes than the signal line. And since the signal line is a moving average of the MACD line, it’s expected to lag.
Therefore, when a new trend is emerging in the market, whether bullish or bearish, the MACD line is expected to react faster and cross the signal line.
Bullish MACD Crossover
In a bullish market, the MACD line crosses above the signal line. This indicates the beginning of a bullish trend in the market, with the buyers pushing prices up. Typically, a bullish MACD signal will coincide with the MACD histogram turning green and crossing above the zero line.
After the crossover, the MACD line will rise faster and diverge from the signal line towards the zero line. This is usually a good indicator that the strength of the bullish trend is increasing.
The ideal place to exit a long trade is when the MACD histogram begins to drop below the zero line. This is usually a good signal that the bullish momentum is waning.

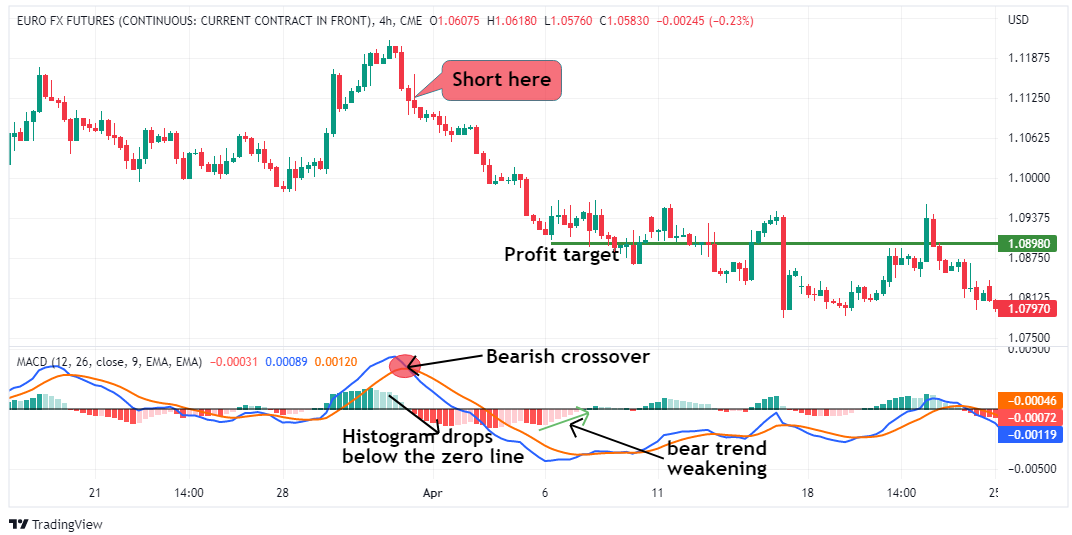
Bearish MACD Crossover
A bearish market begins when the MACD line drops below the signal line. Generally, a bearish MACD crossover coincides with the histogram turning red and crossing below the zero line.
After the bearish crossover, the MACD line will continue falling faster and diverge away from the signal line towards the zero line. This indicates an increase in the strength of the bearish trend.
The ideal exit point after short-selling is when the bear trend begins to weaken. This usually occurs when the MACD histogram begins to rise above the zero line.
What is MACD Divergence?
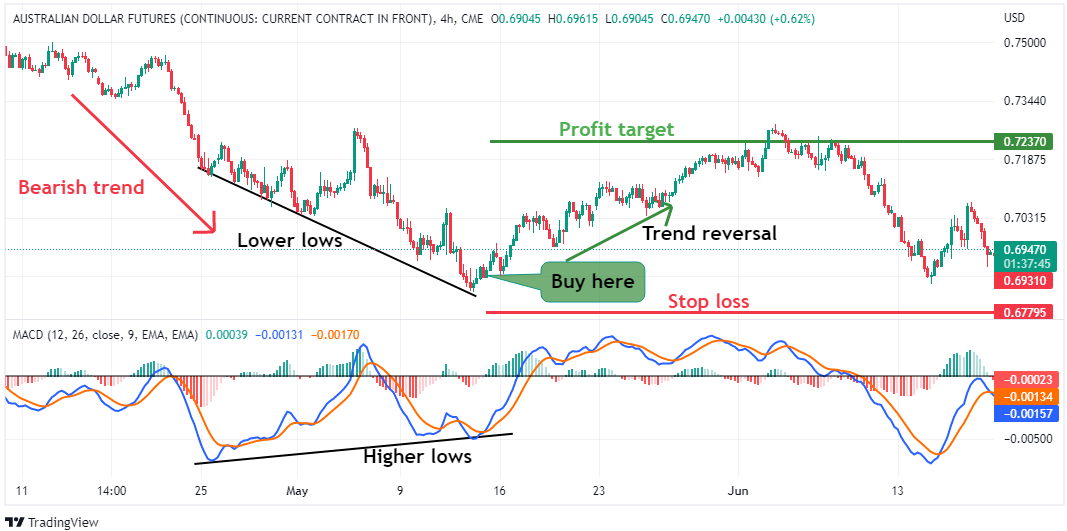
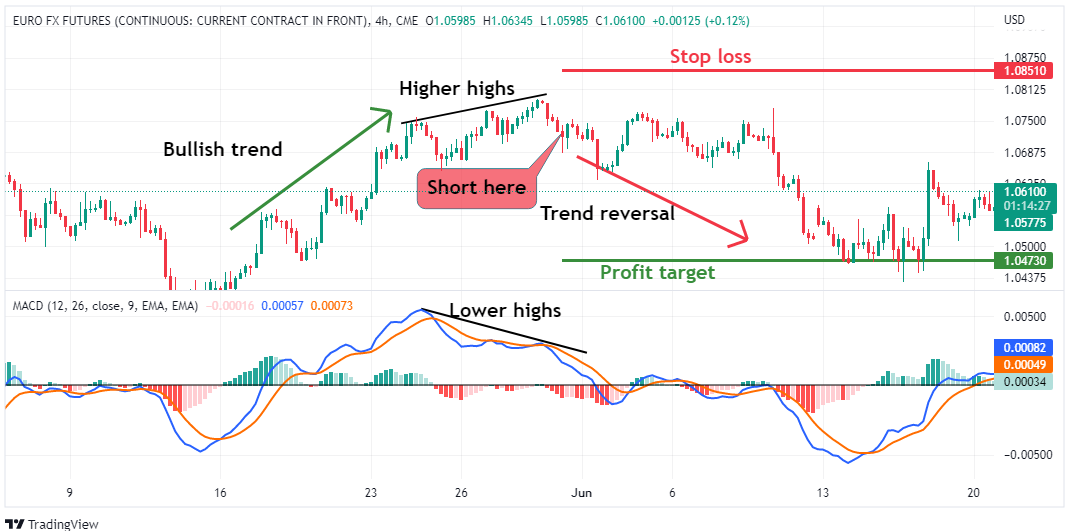
The MACD divergence simply means that there is a disconnect between the price action and the MACD momentum. It occurs when the price action forms higher highs while the MACD forms lower highs or when the price action forms lower lows with the MACD forming higher lows.
Generally, MACD divergence provides good signals that the trend is weakening, and they can be used to determine optimal exits. However, these divergences aren’t always accurate signals for upcoming trend reversals, so you should wait for the MACD crossover to confirm if a new trend is forming.
Bullish MACD Divergence
A bullish MACD divergence usually forms towards the end of a bearish trend when the price action hits lower lows while the MACD forms higher lows. This shows that the momentum of the downtrend is weakening and could potentially reverse into a bullish trend.
Bearish MACD Divergence
A bearish MACD divergence usually signifies that a bullish trend is ending. It forms when an asset’s price forms higher highs, but the MACD forms lower highs signaling that the bullish momentum is weakening, and the trend could reverse from bullish to bearish.
The Bottom Line
The MACD is a versatile 2-in-1 indicator showing an asset’s trend and momentum. It has four main components – the signal line, the MACD line, a histogram, and a 0-line. The MACD line is calculated by subtracting the 26-period EMA from the 12-period EMA, and the signal line is a 9-period EMA line.
The simplest way to trade the MACD is with the crossover between the MACD line and the signal line. A bullish trend begins when the MACD line crosses above the signal line, while a bearish trend begins when the MACD line drops below the signal line. On the other hand, MACD divergence shows that a trend is weakening.
The logic behind MACD divergence is simple. In an uptrend, a bearish MACD divergence implies that although the price is rising, the momentum isn’t enough to make it rise further. Conversely, a bullish MACD divergence in a downtrend implies that although the price is falling, there just isn’t enough momentum to push it further down.
For more insights into market indicators and chart patterns, explore our range of trading strategy articles, including our blog on the most popular chart patterns and how to read them.
