

The Dark Cloud Cover is a candlestick pattern identifying bearish market reversals. The pattern is easy to spot and analyze, and you can use it as a signal to enter short positions or exit long positions.
This guide will talk about what Dark Cloud Cover is and the Dark Cloud Cover scalping strategy. Scroll down to read the blog or click on the button below to watch the video.
What is a Dark Cloud Cover?
The Dark Cloud Cover is a bearish candlestick pattern that begins with a large bullish candle. It is followed by a bearish candle that opens higher but ends in the lower half of the price level of the first candle.
This candle’s bearish nature and name stem from the fact that it begins higher but erases more than half of the preceding candle’s gain. The candle begins sunny, but suddenly black clouds arrive.
It suggests that buyers drive the price higher at the start of the session, while sellers take control later in the session and drive the price lower. This move from buying to selling suggests that a price reversal to the south is possible.
Most traders regard the Dark Cloud Cover pattern to be beneficial only near the end of an uptrend. As prices climb, the pattern becomes clear for a downward reversal.
If the price movement is choppy, the pattern is less noteworthy because the price activity continues to be rough following this pattern.
How to identify the Dark Cloud Cover pattern?
First, check that an asset is trending upward to recognize a Dark Cloud cover. Next, observe the magnitude of the bullish candles to determine if there are any indications that the bullish momentum is slowing.
The first candle on the chart is a bullish green candle with a wider price range than the usual candle. This is key to the pattern’s setup since it shows a high level of buying interest in the market.
The second candle opens higher and then works lower, letting go of the lower part of the first candle’s body. As the price swiftly retraces downward, this signals a weak bullish advance.
More aggressive traders may consider starting a short trade on the next candle’s open. The bearish Dark Cloud Cover pattern implies the potential of exiting all or part of a long trade for traders who have already taken a long position in the market.
Difference between the Dark Cloud Cover and Bearish Engulfing patterns
The Dark Cloud Cover candlestick pattern may resemble a novice trader’s Bearish Engulfing candlestick pattern. They do have certain similarities, but there are a few differences.
First, the Dark Cloud Cover needs larger-than-average candle pricing ranges. The first candle in the Bearish Engulfing pattern has no size limitations.
Furthermore, the second candle of the Dark Cloud Cover pattern just needs to cover half of the first candle. The second candle must entirely engulf the first candle’s body in the Bearish Engulfing.
As a result, the Bearish Engulfing pattern must cover 100% of the initial candle, which may be small, but the candles in the Dark Cloud Cover will be larger than average.
How to trade the Dark Cloud Cover candlestick pattern?
Trading Dark Cloud Cover Patterns is dependent on your entry. If you already long the asset, it may be advisable to consider exiting as soon as the confirmation candle appears.
The price is projected to decline. Set a stop-loss slightly below the low price of the bullish candle that formed the pattern.
If you want to go short, put a stop-loss slightly above the first bearish candle in the pattern’s formation and a take-profit at or below the recent low formed before the price run-up.
Remember that there is no right or wrong way to determine a price target for this pattern; much depends on the strength of the reversal.
Scalping Strategy using the Cloud Cover Pattern
Now that you know what the Dark Cloud Cover is, let’s see how we can scalp the market using this pattern.
Before entering the trade, we first need to identify the pattern.
We look for the pattern when the market is trending upward. Here we can scalp one or two trades with a risk/reward ratio of 1:1 or 1:2.
A key point to add here is that this is an advanced trading strategy, and a deep understanding of technical analysis would be useful.
Trading against the trend can trigger emotions, but it is highly beneficial for quick in-and-out gains.
Our strategy is perfect for those who don’t have a lot of time to sit in front of their computers and monitor their charts all day. The strategy works on all timeframes, particularly ranging from the1m to 15m. In our example below, we use the 5m chart.
Here are the things you need to look for when applying the strategy:
- First, the market is in an uptrend.
- After the peak or thrust in an uptrend, there is a long green candle.
- The next candle is red, and it opened near the high of the previous candle.
Now let’s take a closer look at how to trade the pattern.
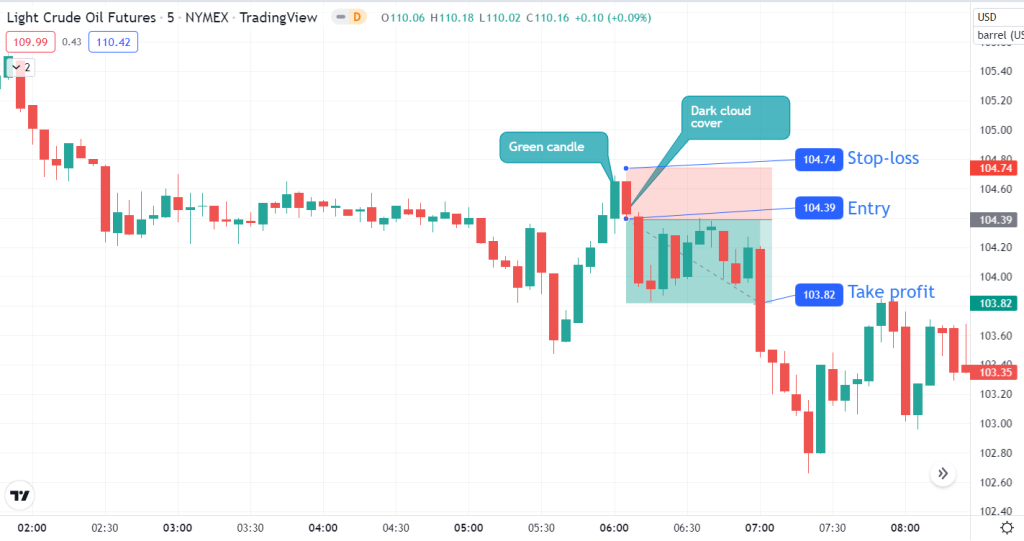
On the chart below, we have identified a Dark Cloud Cover pattern. Here you can see that all the conditions we mentioned above are satisfying.
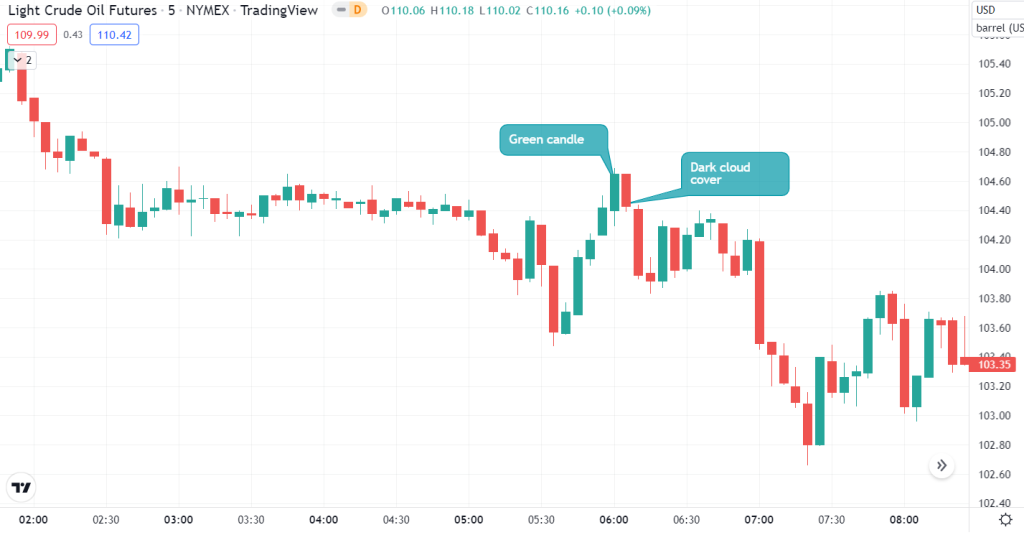
The market is in an uptrend. Therefore, there is a red candle after the previous bullish candle, and the red candle opens near the previous candle’s high.
As you can see, there is a strong bearish move after the appearance of the Dark Cloud Cover.
Some of you may be wondering why we have chosen this particular area.
As mentioned above, the idea of trading with the Dark Cloud Cover is to look for a potential reversal by identifying the red candle that proceeds afterwards.
Now for the red candle, it opened near the close of the previous bullish candle. So, the closer the close of the bearish candle is to the bullish candle, the better the Dark Cloud Cover will be.
If the price decides to trade above the high of the green candle, our setup will be invalidated, and we may have to take a loss for the trade. That’s why we mentioned that this strategy requires an understanding of technical analysis.
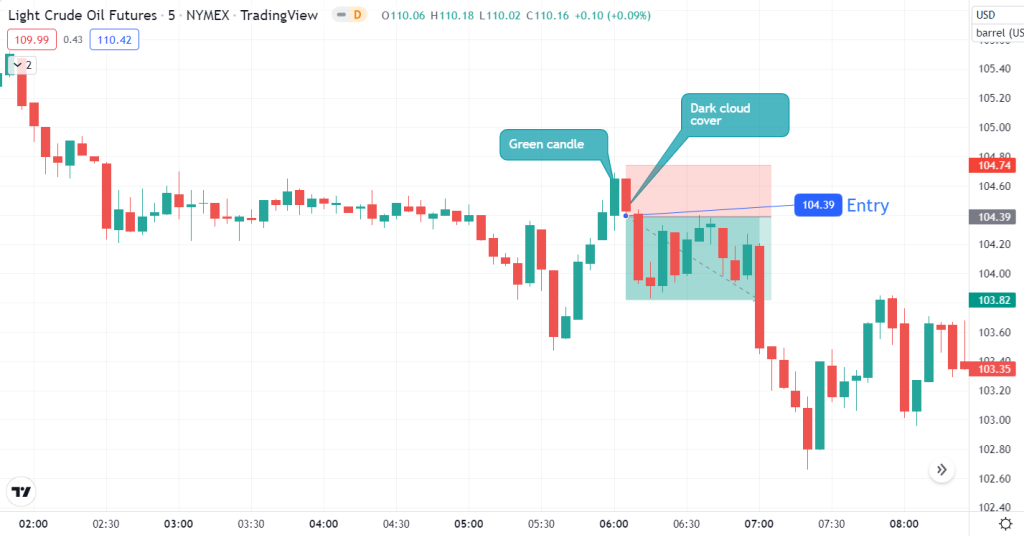
Entry
We can take a position at the end of the Dark Cloud Cover candlestick to enter the trade. It is one of the most important points you need to remember.
We wait for the price action to continue its path with the full-bodied red candlestick.
Some traders use the bars to figure this out, but we have used the candlestick chart here.
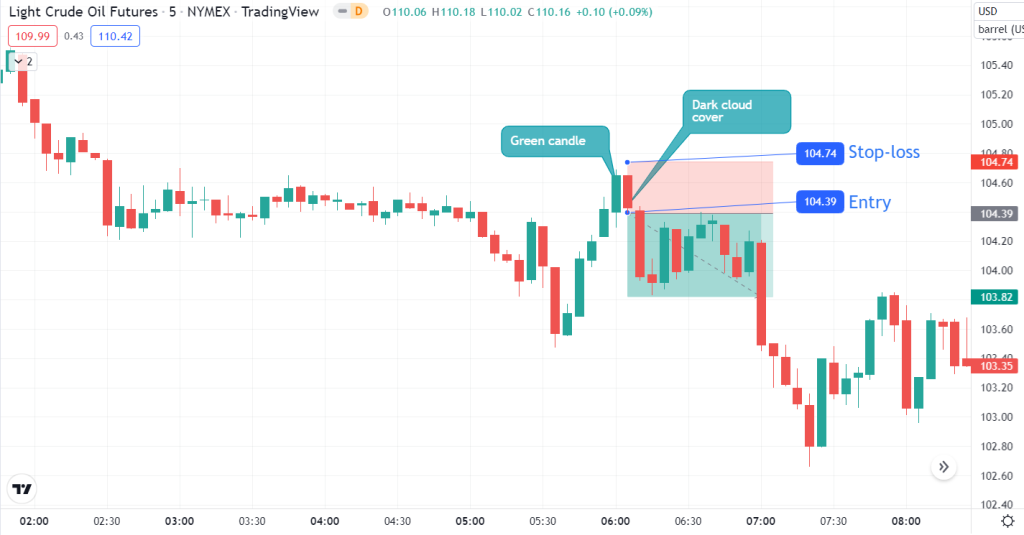
Stop-loss
The stop-loss placement depends on your risk tolerance. We have placed the SL slightly above the high of the green candle for this trade.
Take-profit
After entering and placing a stop-loss, we need to set our profit target. Again, as it is a scalping strategy, we want to see the market move in our direction quickly, and we don’t want to hang in the trade for too long.
We can set a 1:1 to 1:2 RRR and exit the trade.
Or, we can put our stop-loss at breakeven and go for a 1:2 take-profit. It’s completely up to you where you want to place the profit target.
Dark Cloud Cover false entry
Now that you know the scalping strategy, we want to tell you about the false entry. Dark Cloud Cover can pop up frequently on shorter timeframes, so it’s important not to fall prey to false entries.
On the chart below, you can see a false Dark Cloud Cover.
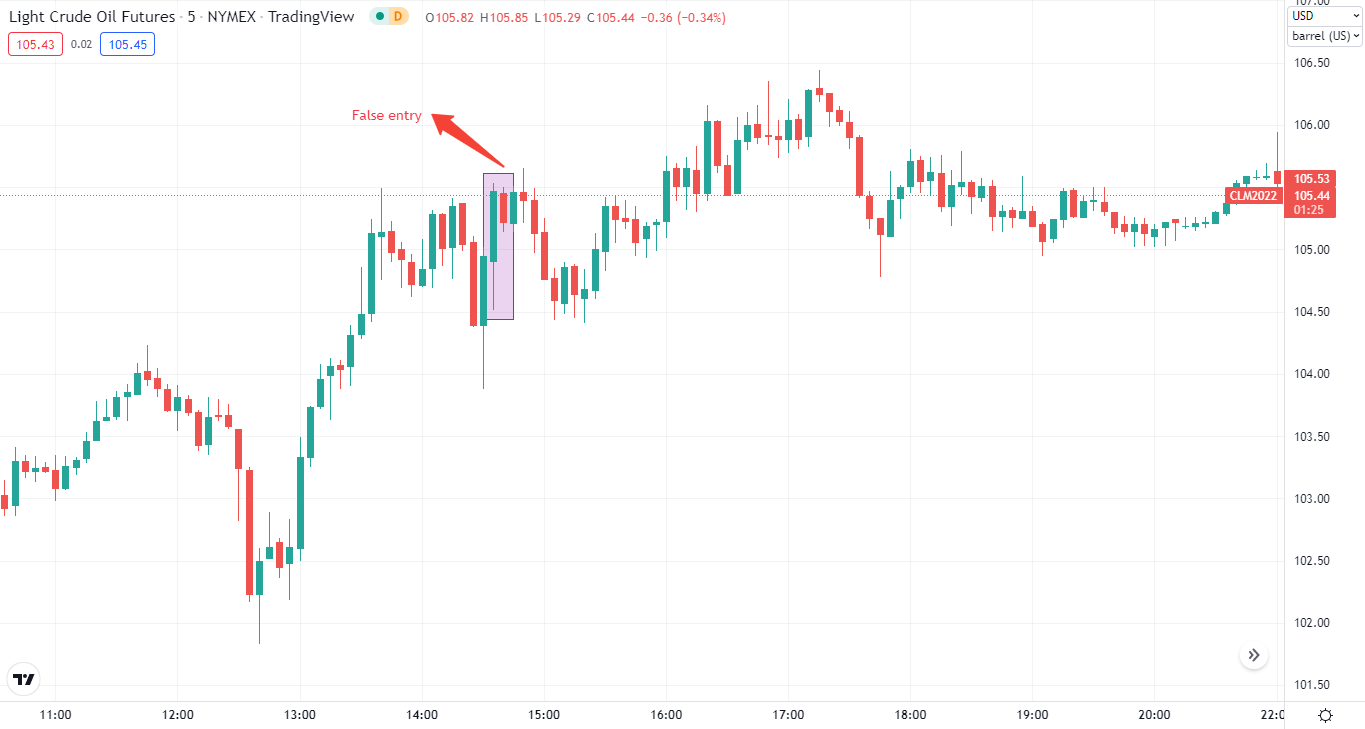
When you look at the conditions, you question why it is a false entry. There is an uptrend, a bullish and a bearish candle, and the bearish candle is close to the high of the previous candle.
We can’t consider this a Dark Cloud Cover because of the bullish candle. However, the red candle is far below the previous one, which may not complete the reversal.
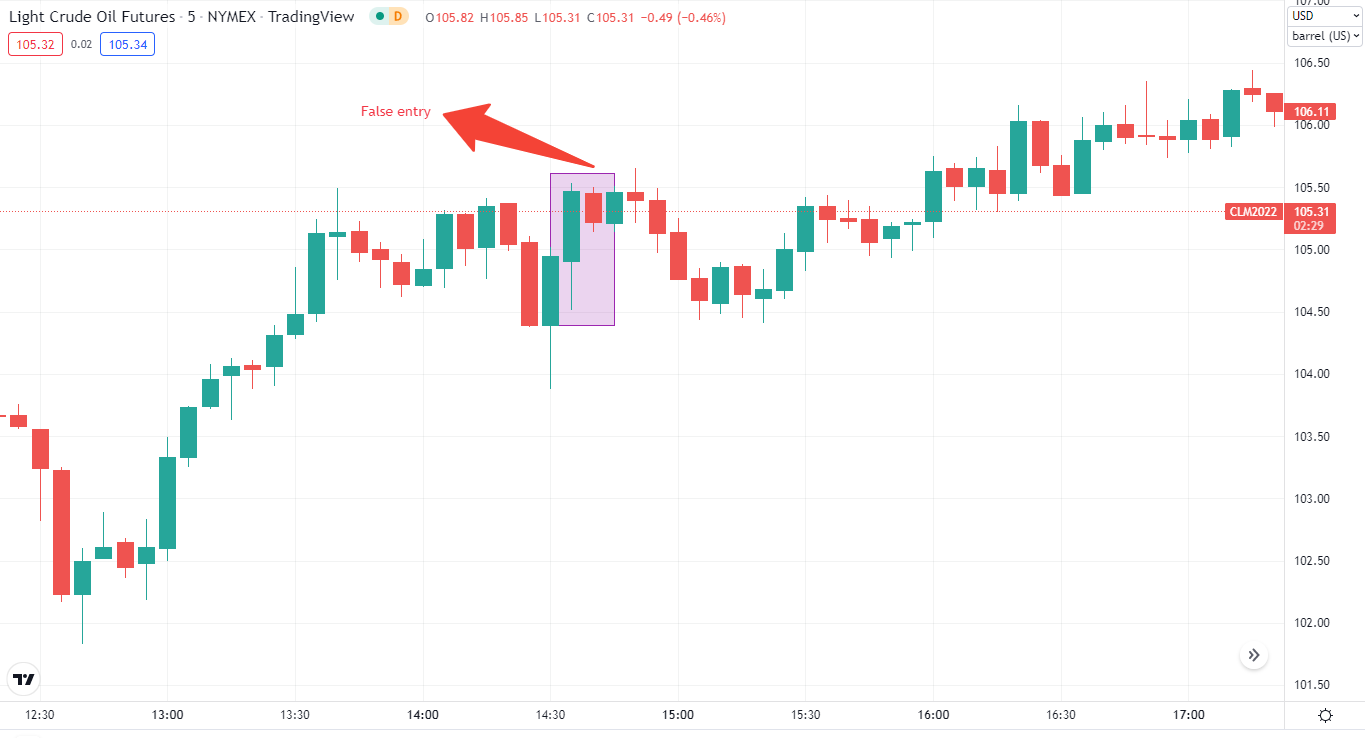
If you zoom in, you can find out what we are talking about.
Is Dark Cloud Cover worth a try?
The Dark Cloud Cover pattern is a great predictor of a bearish reversal. However, sometimes you need to look for confirmation from technical indicators like the RSI, MACD, and others.
Not all Dark Cloud Cover patterns form after an uptrend, as we mentioned in the false entry section. However, if they do, it indicates a powerful signal.
A key point to add here is that the pattern appears after an uptrend. Therefore, if you combine it with indicators like the RSI, it’ll signify overbought.
Dark Cloud Cover Trading Strategy Video Example
The Dark Cloud Cover is a great pattern for identifying a bearish reversal, and you can spot the pattern on any timeframe. The Dark Cloud pattern presents a great opportunity for those looking for quick in-and-out trade.
It’s important to remember the points mentioned above to recognize the pattern and not fall prey to the false entry.
Want to learn about other candlestick patterns? Read our blog on the most popular candlestick patterns.
