

Continuation chart patterns occur in a trending market and typically indicate a momentary period of price consolidation before the market continues trending in the previously observed trend. This guide focuses on one such chart pattern – the flag chart pattern. We’ll break down the bear and bull flag pattern trading.
What is the Flag Chart Pattern?
The flag chart pattern is a trend continuation chart pattern. The flag pattern gets its name from the fact that the price action of the pattern resembles a flag on a flagpole. Typically, the flag chart pattern forms when the market is in a sustained trend – bullish or bearish, followed by a period of consolidation before the preceding trend continues.
This means you can take advantage of the momentary pause in the prevailing trend to jump in on the trend. Here’s how the typical bear and bull flag chart patterns look like.

The flag chart pattern usually has six distinctive properties:
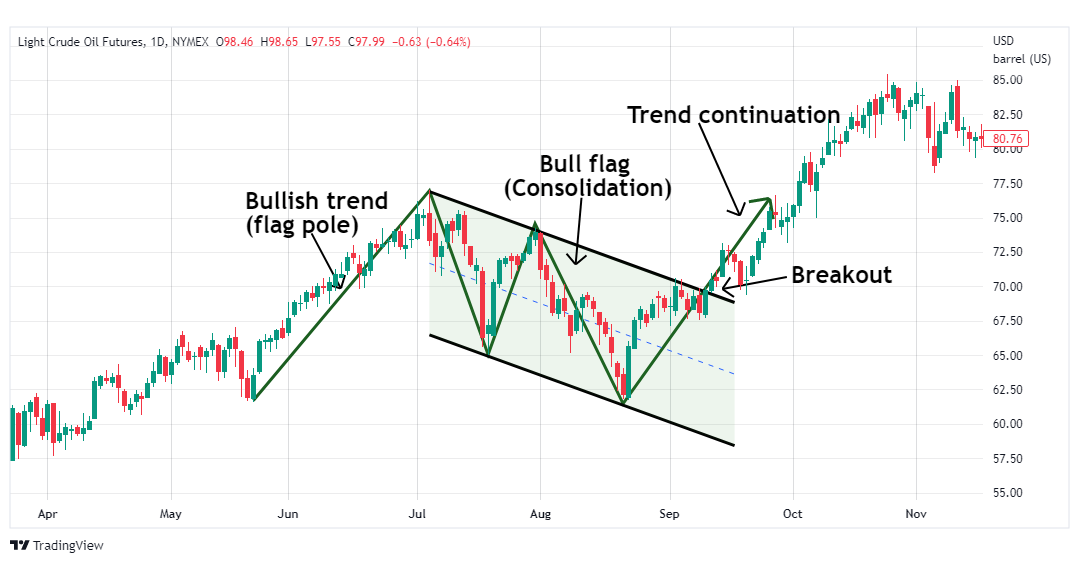
The Flag Pole/ The Preceding Trend
The flag pole is usually the preceding trend in the flag chart pattern – naturally, it can either be a bullish or bearish trend. Usually, the first step in flag pattern trading is to identify the flag pole. So, arguably, the most important feature of a flag chart pattern is the flagpole, which corresponds to a strong price movement. Look for strong and obvious price boosts with successive price sticks, price gaps, and strong volume, all pointing in the same direction.
The Flag
The flag is an area of consolidation after the sustained trend witnessed by the flagpole. It represents a brief interruption of the trend before it continues, i.e., the price movement continues in the prior trend.
Keep in mind that the flag comes in all shapes and sizes; it can be a horizontal, upward, or downward channel. Typically, when trading the flag pattern, we are less concerned with the exact shape of the flag. Instead, please pay close attention to the strength of the trend as indicated by the flagpole and the extent of the pullback regardless of whether it’s shallow or deep.
Support and Resistance Levels
The resistance in the flag chart pattern is the flag’s upper line, and the support is the lower line. The resistance and support in a bull flag pattern are downward sloping and rising in a bear flag pattern.
A Breakout
The breakout in a flag chart pattern occurs when the price rises above the resistance or breaks below the support level. The breakout usually plays a key role in determining the possible entries and exits. For a bull flag, the entry is usually just above the resistance level and below the support for a bear flag pattern.
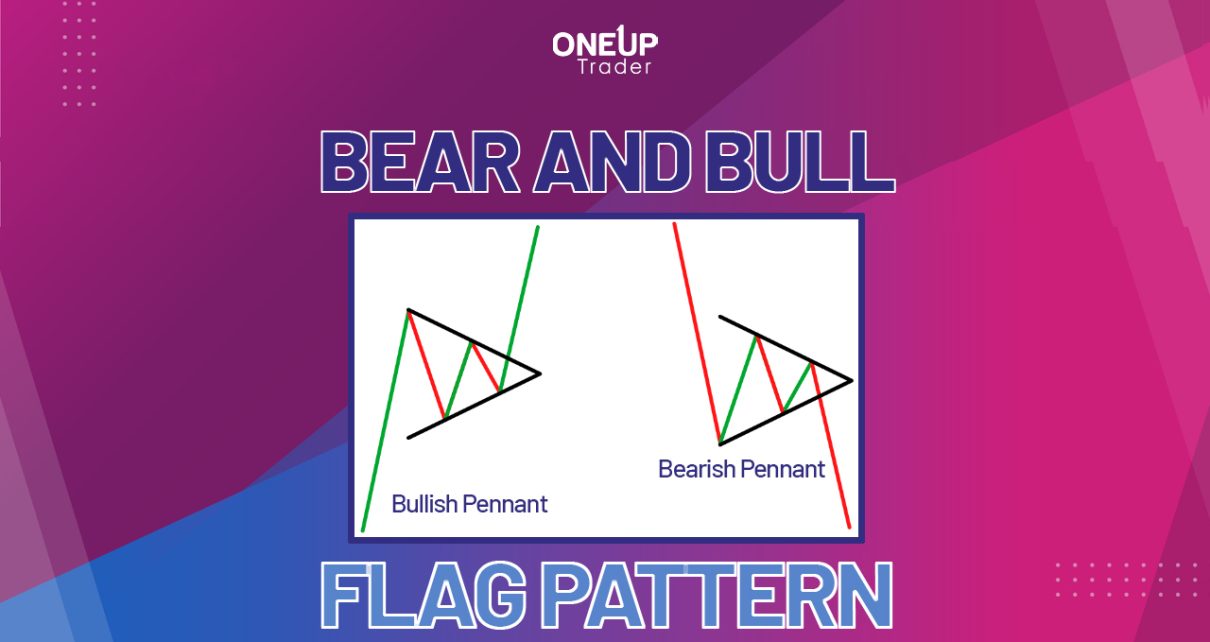
Flag Chart Pattern vs Pennant Chart Pattern
It’s common to see flag chart patterns mentioned alongside pennants. That’s because the two are identical, the only difference being that pennants have converging trendlines during the consolidation phase. For a flag chart pattern, the consolidation phase tends to have parallel support and resistance trendlines. Other than that, the trading strategy for the bull flag and bull pennant chart patterns are similar, and bear flag and bear pennant trading are similar too.
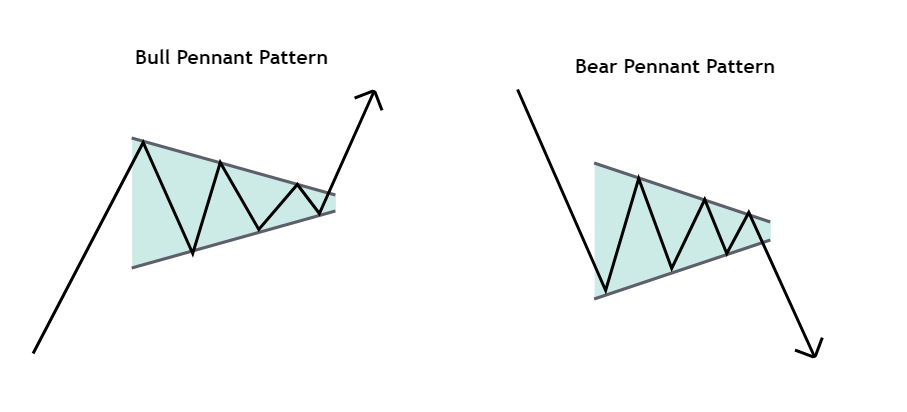
Bull Flag Chart Pattern
A bull flag is a bullish continuation chart pattern. This means that a bull flag chart pattern appears when an asset is in an uptrend. As we mentioned earlier, the flag pole represents the bullish trend. The flag is inclined downwards or descending, representing a short-term price pullback – a consolidation region before the trend breaks out.
The first step in identifying a bull flag pattern is identifying the flagpole. In this case, it’s a sustained bullish trend, usually accompanied by a steady increase in the volume. The volume drops toward the top of the flag pole as the price enters a consolidation phase. The consolidation phase is usually a slight price pullback that doesn’t retrace 50% of the flagpole. If the consolidation phase (the flag) covers the entire flag pole, the market is reversing.
The consolidation phase usually comes when some buyers exit their positions, causing the prices to drop. In a bull flag, any short sellers who enter the market during the consolidation usually get caught in a bear trap when the price breaks above the flag. And as they exit the market to cover their short positions, they inadvertently drive the prices higher. The breakout from the bull flag is often accompanied by an increase in the volume, although it may not necessarily be as high as the volume on the flag pole.
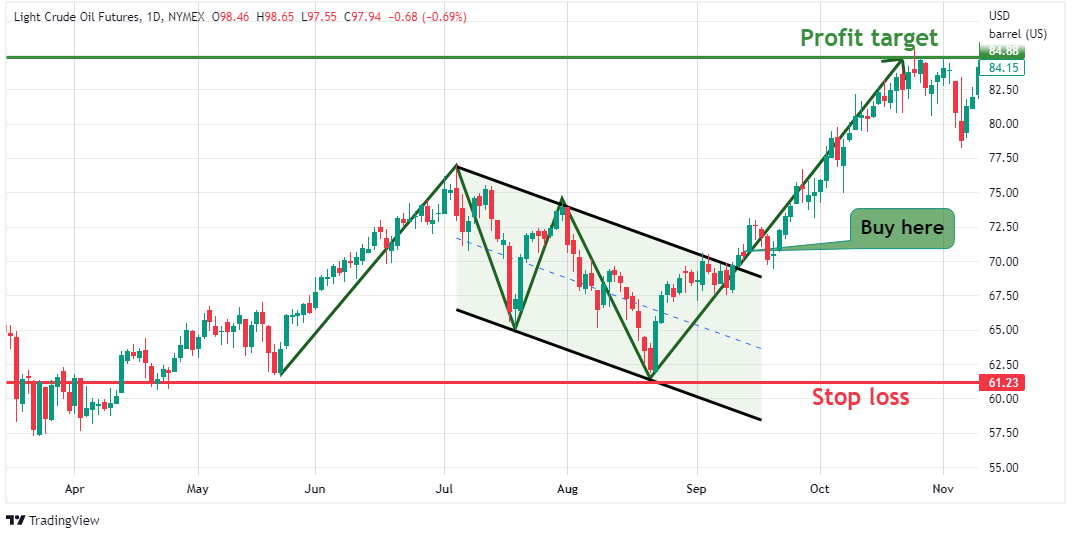
Bull Flag Pattern Trading
The simplest way to execute bull flag pattern trading is to use the breakout trading strategy – in this case, price breakout above the bull flag. Ideally, open a long position when the price action breaks and closes above the resistance. A breach of the upper trendline confirms the continuation of the bullish trend. Note that if the price breaks through the upper trendline but closes below it, you can adjust the line to match the breakout while the pullback continues. This simply means the buyers didn’t have enough momentum to push the price higher.
When trading the bull flag pattern, your stop loss should be at the lowest point of the flag. Ideally, you should set the profit target equivalent to the height of the flagpole.
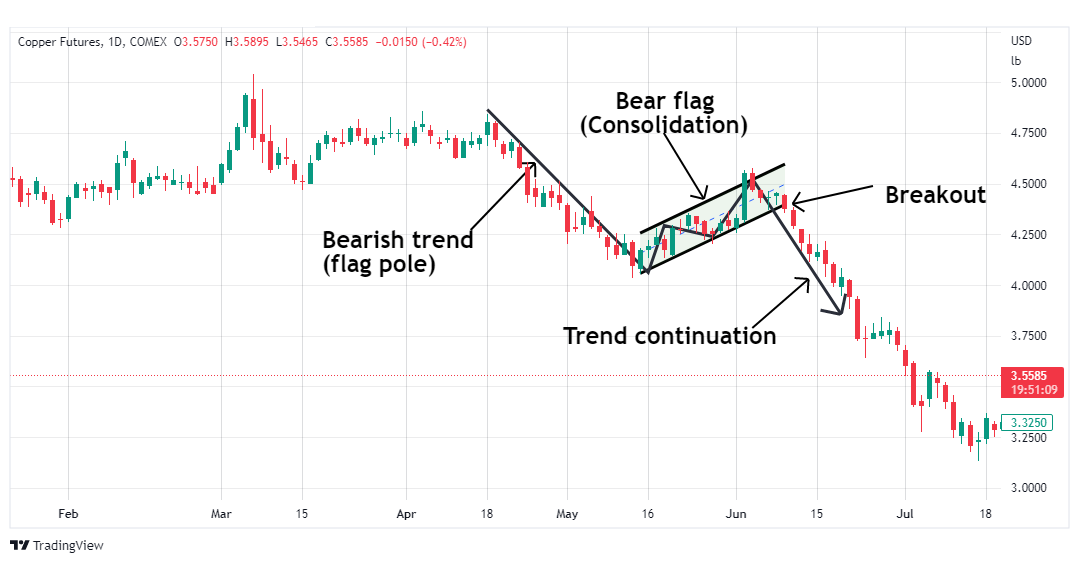
Bear Flag Chart Pattern
A bear flag is a bearish continuation chart pattern, which means that a bear flag chart pattern appears when an asset is in a downtrend. It’s the direct opposite of the bull flag pattern – the flagpole in the bear flag pattern represents a sustained bearish trend. The flag, in this case, is inclined upwards, representing the short-lived price pullback – the pattern’s consolidation phase before the breakout.
As mentioned, the flag can take any shape, which makes the difference between a regular bear flag chart pattern and a bear pennant chart pattern. The bear pennant pattern is formed when the consolidation phase has converging trendlines.
Just like with the bull flag, the first step in identifying a bear flag chart pattern is to identify the flagpole, which, as we mentioned, is the sustained bearish trend with the consolidation phase towards the bottom of the flagpole. The consolidation phase is usually a slight price pullback. Keep in mind that the pullback forming the bearish flag does not extend beyond the pole. This would mean that the price action is turning bullish.
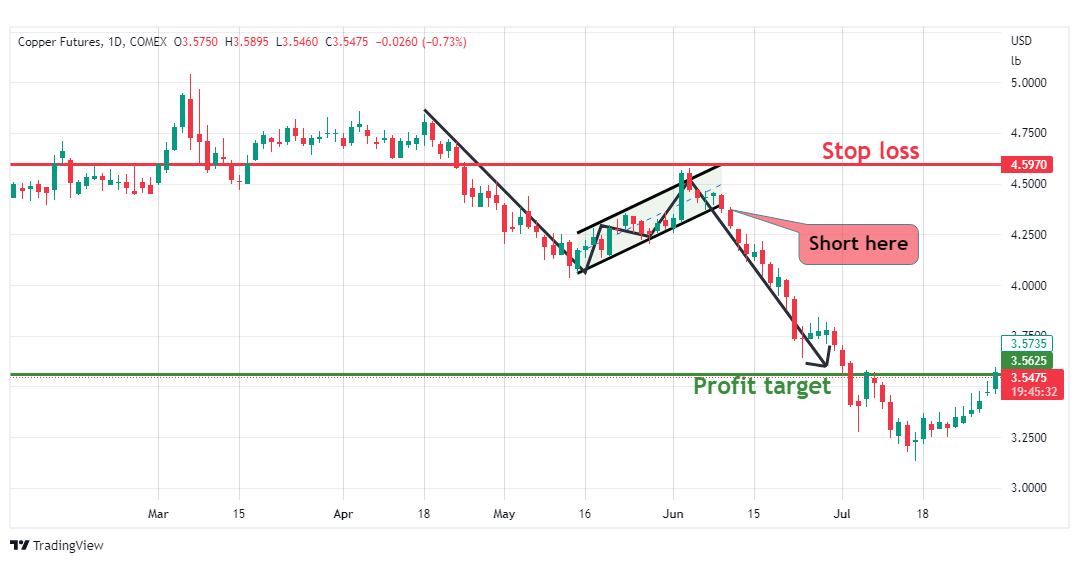
Bear Flag Pattern Trading
After identifying a bear flag chart pattern, your entry for a short position should be when the price action breaks below the flag’s support level. To be on the safer side, you should wait for the price to break and close below the support before shorting the market. This confirms the continuation of the bearish trend.
If the price breaks below the support line but closes above it, you can adjust the lower trendline to match the breakout while the pullback continues. This means the sellers didn’t have enough momentum to push the price lower. Unlike the bull flag chart pattern, the volume doesn’t always drop during the consolidation phase in the bear flag. The logic behind this is that the drop in price, as witnessed in the bull flag, is usually driven by traders’ fear and anxiety over falling prices. And the more prices fall, the more the urgency for them to take action. However, the volume should decrease as the flag chart pattern forms and increase when the price breaks below the support level.
When trading the bear flag chart pattern, your stop loss should be at the highest point of the flag, just above the resistance. The profit target is equivalent to the height of the flagpole.
The Bottom Line
A flag pattern is a continuation chart pattern, which means it forms during a temporary price consolidation period before the preceding trend resumes. This chart pattern can be categorized as either a bull flag pattern, a bullish continuation chart pattern, or a bear flag pattern, a bearish continuation chart pattern. And as discussed throughout this guide, the simplest strategy for the bear and bull flag pattern trading is to employ the breakout trading strategy. And, just like when trading with any chart pattern, it is often advisable to use momentum and trend indicators to ascertain your entry levels.


