

Technical indicators have always been faulted for lagging, making price action analysis invaluable to any trader. With hundreds of chart patterns to choose from, it may not be easy to decide which one is more reliable and suited to your trading style. However, it’s a general consensus that the ideal ones should generally be easy to identify and offer well-defined entry and exit points. And that brings us to the head and shoulders chart pattern.
The head and shoulders chart pattern is popular and easy to spot. Its popularity stems from the fact that it identifies the prevailing market trend and gives clear entry and exit points. Throughout this guide, we will discuss how to identify both the head and shoulders chart pattern and the inverted head and shoulders chart pattern and establish the entry points and exit points.
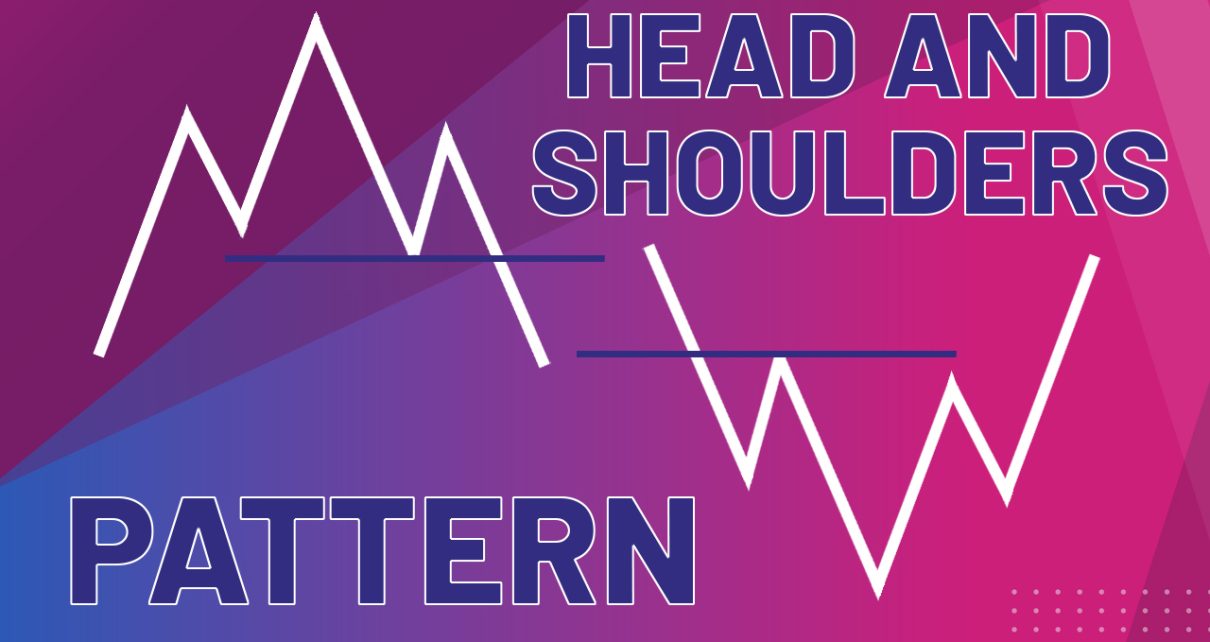
What is the Head and Shoulders Chart Pattern?
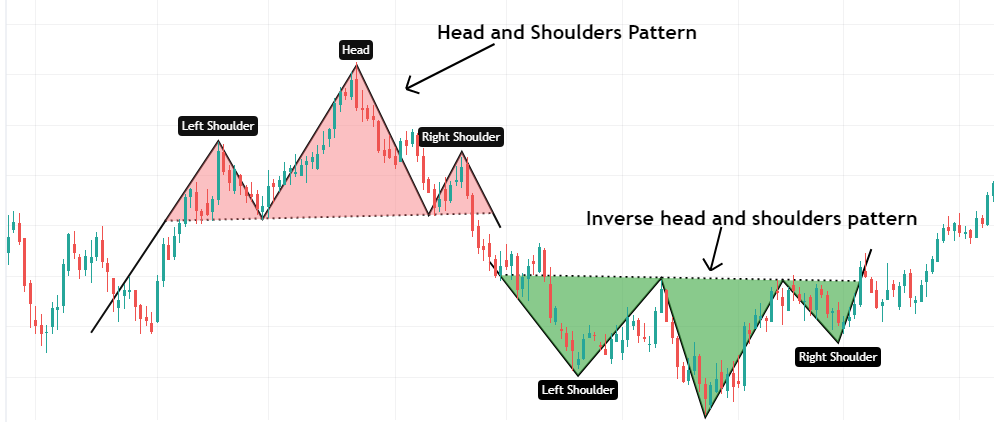
The head and shoulders chart pattern is a bullish-to-bearish trend reversal pattern. The pattern has three well-defined peaks resembling a person’s head and shoulders. It usually forms when a bullish trend begins to weaken, which means that when an asset forms this pattern, you should expect a bearish trend to follow. Ideally, the head and shoulders pattern can appear on any timeframe, making it convenient for all traders.
What does the Head and Shoulders Chart Pattern look like?
As we’ve mentioned, the head and shoulders chart pattern appears as three well-defined peaks, which can be sharp or rounded. A typical bearish head and shoulders pattern has five main components – a preceding bullish trend, the left shoulder, the head, the right shoulder, and the neckline.

A Preceding Bullish Trend
Remember that the head and shoulders pattern is a bullish-to-bearish trend reversal chart pattern. So, for it to appear, the asset must be in a sustained bullish trend first. Note that the duration of the bullish trend can be subjective and entirely dependent on the timeframe you’re trading.
The Left Shoulder
Ideally, all trends – bullish or bearish – are punctuated with momentary price pullbacks. The left shoulder is formed when some buyers embark on profit-taking after the sustained bullish trend. The ensuing sell-off leads to a momentary drop in the price, which forms the first peak.
At this point, it’s impossible to tell whether the head and shoulders pattern will form, primarily because such pullbacks occur regularly in any trending market.
The Head
After the first pullback, the price begins to rise again, mostly because short-term buyers enter the market to take advantage of the price drop. Consequently, this causes the price to rise to a newer, higher high, forming the head of the pattern.
However, after reaching this newer high, the short-term buyers exit the market resulting in another price pullback. At this stage, the head, the left shoulder, and the neckline are fully formed.
The Neckline
The neckline is formed when you connect the support level of the pullbacks from the left shoulder and the head with a horizontal line. In some cases, you could wait for the right shoulder to fully form before you draw the neckline. However, it is convenient to draw it after the left shoulder and the head are formed, and then extend it to the right. This helps you anticipate the support for the right shoulder.
Typically, this horizontal line is used as the entry when shorting the market. Note that in practice, the neckline isn’t always a perfect horizontal – it could slant upwards or downwards, depending on the right and left shoulders’ height.
The Right Shoulder
After the second pullback, the price rises again but doesn’t go as high as to reach the head. The price begins to drop, forming the right shoulder. Although the left and the right shoulders are always lower than the head, the two shoulders don’t necessarily need to be of the same height. More so, the pattern doesn’t always need to be symmetrical.
How to Trade the Head and Shoulders Chart Pattern
Before you trade the head and shoulders pattern, you must wait for it to fully form first. As we mentioned, this is a bullish-to-bearish reversal chart pattern, which means you must wait for the left shoulder and the head to form before you can draw the neckline. Remember, the neckline will be your short-selling trigger after the right shoulder is fully formed.
Depending on your trading style, you can use the aggressive or conservative approach when trading with the head and shoulders chart pattern. Regardless of your chosen approach, the volume traded will always play a key role in determining your entry. A viable head and shoulders pattern breakout will always be accompanied by increased volume traded.
The Aggressive Approach
With the aggressive approach, you immediately open a short position when the price drops below the neckline. Remember that the neckline is regarded as the ultimate support for the head and shoulders chart pattern. Typically, when the price breaches its support means that sellers dominate the market.

The Conservative Approach
Admittedly, the risk of failure when trading with an aggressive approach can be high. Remember that no trading strategy is ever 100% accurate – this chart pattern trading is usually prone to fake breakouts due to price pullbacks, which is the cause of several failed head and shoulders patterns. This is where the conservative approach comes in.
Using this approach is a two-step process. Firstly, you wait for the price to break out of the neckline, then observe if there’s a pullback. This allows you to determine if it was a false breakout or not. Generally, most failed trades with the head and shoulders pattern directly resulted from a false breakout after the right shoulder was formed.
Note that once the price drops below the neckline, it becomes the resistance level. If there’s a pullback, but the price bounces off the neckline, this is your signal to open a short trade. The primary disadvantage of this approach is that it’s easy to miss out on the entry if there is no pullback.
Setting the Stop Loss and Profit Target
Whether you’re trading with the aggressive or the conservative approach, the ideal place for a stop-loss target is just above the right shoulder. The reason is that if the sellers fail to push the prices further below the neckline, then a break above the right shoulder means that the bulls dominate the market.
To set the profit target, calculate the distance between the head and the right shoulder, then subtract it from the neckline. While this is the standard way of determining the profit target, at the end of the day, it all depends on your trading style and financial goals.
Inverse Head and Shoulders Chart Pattern
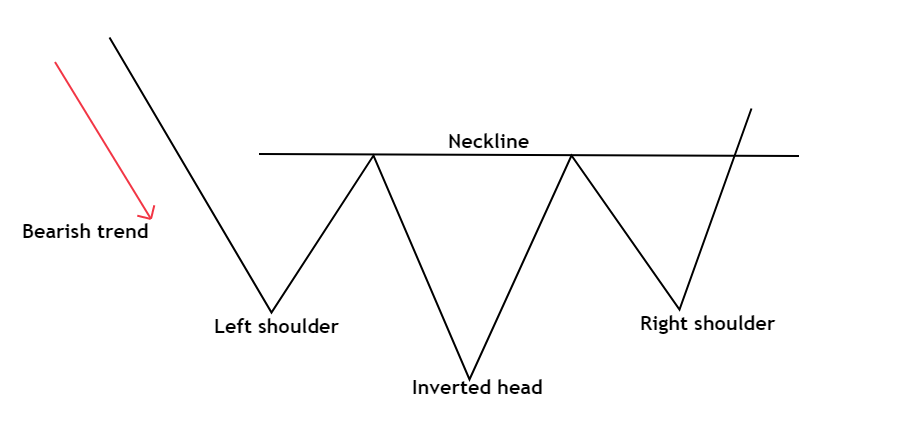
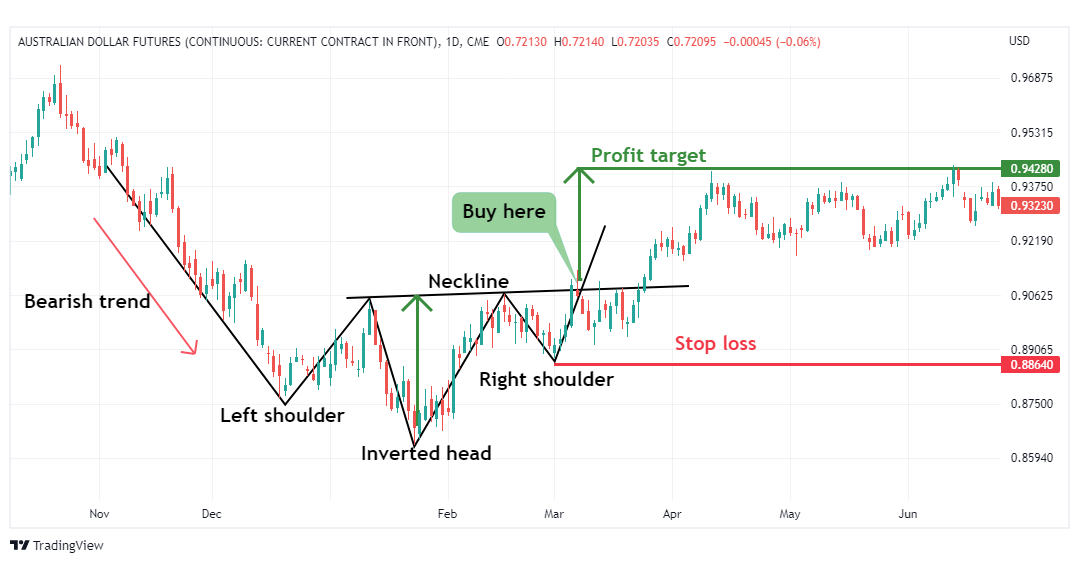
The inverse head and shoulders chart pattern is the exact opposite of the head and shoulders pattern. It is a bearish-to-bullish reversal chart pattern and looks like an upside-down version of the head and shoulders pattern. This pattern usually forms when a bearish trend begins to wane. Therefore, when you spot it, you can expect that a bullish trend is about to begin.
What does the Inverse Head and Shoulders Chart Pattern look like?
The inverse head and shoulders chart pattern also has three well-defined market bottoms, which could be V-shaped or U-shaped. A complete pattern has a preceding bearish trend, the left shoulder, the head, the right shoulder, and the neckline.
A Preceding Bear Trend
Since the inverse head and shoulders pattern is a bearish-to-bullish chart pattern, the asset must be in an existing bear trend. The length of the bear trend is subjective, depending on which timeframe you’re looking at.
The Left Shoulder
The left shoulder in this pattern is formed when the downtrend pauses and is followed by a rise in the price. This is usually caused by short-sellers who embark on profit-taking. And since this involves buying back the asset to cover their short positions, it causes the price to increase.
The Head
The momentary pullback from the left shoulder stops when short-term sellers enter the market. This causes the prices to continue dropping to lower lows below the left shoulder. When these short-term sellers exit the market, the downtrend pauses, causing the price to rise again. At this point, the inverted head is fully formed.
Now the left shoulder and the inverted head are clearly visible, and you can easily establish the resistance level.
The Neckline
Connecting the resistance level between the left shoulder and the inverted head forms the neckline. In most cases, this neckline may not necessarily be a horizontal line. Whether it’s angling upwards or downwards, all you have to do is extend it to the right, giving you a rough estimate of where the bullish entry should be.
The Right Shoulder
After the inverted head is formed, the price drops again, but there’s no momentum to push it any closer to the head. This means that short-term sellers who jumped into the market lacked the momentum to push the prices further down. The price starts rising towards the resistance, which shows that the bearish trend is ending.
How to Trade the Inverted Head and Shoulders Chart Pattern
Since this is a bearish-to-bullish reversal chart pattern, the goal is to take a long position. But first, we have to wait for the pattern to form fully. Typically, after the right inverted shoulder is formed, the neckline, which is also the resistance level, serves as the trigger for the buy trade.
Similar to the head and shoulders pattern, you can use the aggressive or conservative approach when trading the inverted chart pattern. It’s also advisable to use volume indicators to confirm if there’s an increase in the volume traded after the inverted right shoulder forms.
The Aggressive Approach
The aggressive approach is straightforward – you buy when the price breaks above the neckline. For the inverted head and shoulders pattern, the neckline serves as the resistance, which means that its breakout is bound to be followed by a bullish trend. And as we mentioned, volume analysis plays a key role too. It helps you determine if buyers are dominant in the market.
The Conservative Approach
This approach aims to reduce the probability of losses from false breakouts. That means ignoring the aggressive approach and waiting for the price to pull back to the neckline after the initial breakout. Note that after a breakout above the neckline, this resistance becomes support. So, only open a long position if the price breaks out, then drops back to retest the neckline but doesn’t drop below it. This shows that the buyers dominate the market.
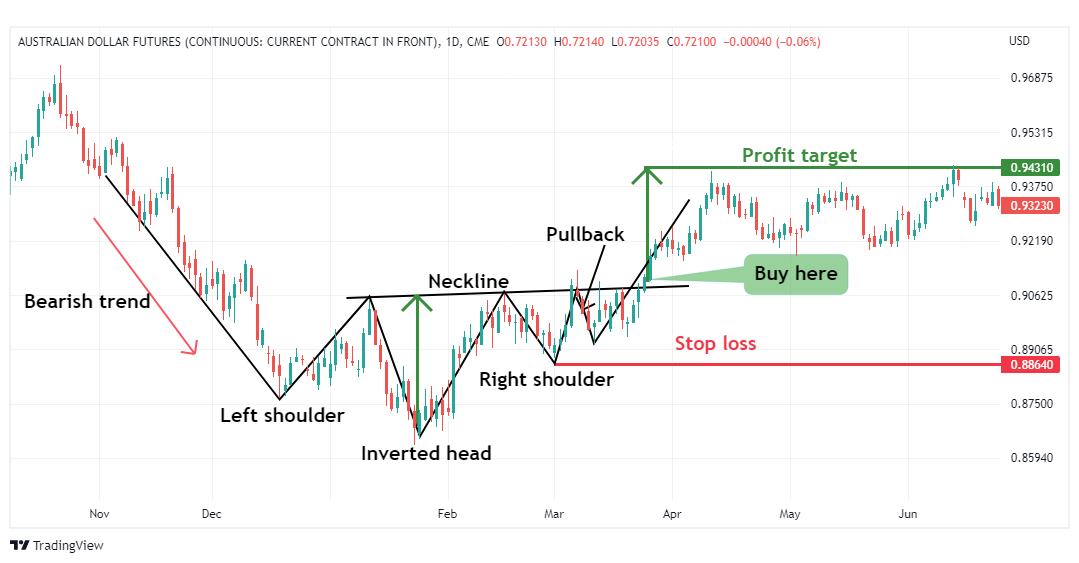
Setting the Stop Loss and Profit Target
Generally, your trading style and financial objectives dictate where you set the stop loss and profit targets. However, when trading the inverted head and shoulders chart pattern, it’s prudent to set the stop loss just below the inverted right shoulder. That’s because if the price breaks above the neckline but then drops back below the right shoulder, it means that the bulls failed to take charge of the market.
On the other hand, you can set the profit target based on the distance between the inverted head and the right shoulder. Simply measure the distance, then add it to the neckline.
The Bottom Line
The head and shoulders pattern and the inverted head and shoulders pattern can be identified on all timeframes. The former presents an imminent bullish-to-bearish trend reversal, while the latter is a bearish-to-bullish reversal. The structure in both chart patterns is relatively similar, making them easy to spot and convenient to trade with. The basic idea is to short the market when the price breaks below the head and shoulders neckline and go long with a breakout above the neckline in the inverted pattern.
For more insights about different chart patterns, check out our blog on the most popular chart patterns and how to read them.
