

Trading the support and resistance levels of an asset is probably one of the oldest and most reliable technical strategies. It goes without saying that asset prices never trend in a straight line – any trending market is often punctuated with momentary pullbacks or retracements. This is where Fibonacci retracement levels come in. These levels are an asset’s support and resistance, indicating areas of a potential reversal.
Throughout this guide, we’ll discuss how to draw Fibonacci retracements and use them in trading.
What are Fibonacci Retracement Levels?
Fibonacci retracement levels are horizontal lines indicating areas of support and resistance where an asset’s price could potentially reverse. The operative principle here is that of retracement.
In trading, retracement is a temporary reversal in the price WITHIN a dominant trend. We emphasize the word ‘within’ since it makes the semantic difference between a complete reversal and a retracement. Generally, a reversal means that the current trend has ended, and either an opposite one is beginning or a price consolidation is starting. On the other hand, a retracement is merely a temporary pullback, with the trend expected to continue; the Fibonacci retracement levels are used to show potential regions of trend reversals or breakouts.
Remember that Fibonacci retracement levels depend almost entirely on herd behavior since traders are more likely to take profits or cover losses at certain price points. This is the guiding principle when trading the Fibonacci retracement levels.
The most commonly used Fibonacci retracement levels include 23.6%, 38.2%, 50%, 61.8%, and 78.6%. While Fibonacci retracements determine the range of price pullback within a dominant trend, Fibonacci extensions are used to show regions of potential support or resistance outside the selected price range. Typically, Fibonacci extension levels include 123.6%; 138.2%, 150.0%, 161.8%, and 261.8%.
To fully understand how the Fibonacci retracement levels work, let’s first discuss how they are calculated.
How to Calculate Fibonacci Retracement Levels
Fibonacci retracement levels are based on the Golden Ratio derived from the Fibonacci sequence. The sequence starts with 0 and 1, and every subsequent number in the series is the sum of the preceding two numbers and goes on to infinity. Here are the first few numbers in the Fibonacci sequence: 0, 1, 1, 2, 3, 5, 8, 13, 21, 34, 55, 89, 144, 233 …
If you divide a number in the Fibonacci series by the immediate next number, you get a value close to 0.618 (for example, 21/34 = 0.6176 ~ 0.618). Similarly, if you divide a number by the number after that, the result is always close to 0.382 (for example, 21/55 = 0.3818 ~ 0.382); and if you divide any number by one that’s three places higher, you get the 0.236 ratio (for example, 55/233 = 0.236). Note that the 0.786 Fibonacci ratio is the square root of the 0.618 ratio.
Each of these Fibonacci retracement levels can be converted to a percentage. As we mentioned earlier, most commonly used Fibonacci retracement levels are 23.6%, 38.2%, 50%, 61.8%, and 78.6%. And although 50% isn’t a Fibonacci ratio, it’s used to show the midpoint. These percentages show just how much an asset’s price has pulled back. Ideally, technical analysis takes advantage of this characteristic by assuming that price fluctuations follow the Fibonacci retracements.
How to Use Fibonacci Retracement Levels
Fibonacci retracement levels are preferred in technical analysis since they’re considered predictive – they map out an asset’s potential price movements. However, when using the Fibonacci retracements, it’s important to remember that these levels work best in a trending market. That means you must first identify either a bullish or bearish market before you can apply the Fibonacci retracement levels on your chart.
Once you’ve drawn the Fibonacci retracement, the different lines can be used as entry targets, depending on the strategy.
23.6% Retracement: Suitable for high momentum trades. A higher volume usually accompanies the trend.
38.2% Retracement: A rather less important level. The market will mostly move on to the 50% retracement.
50% Retracement: This is the most important and effective retracement of the Fibonacci tool. It shows the average price fluctuation from either the swing low or high. The 50% line is usually regarded as the most important of Fibonacci retracement levels. It shows exactly the average or half of the movement.
61.8% Retracement: The market typically oscillates between 38.2% and 61.8% retracement. This is where optimal pullback trades occur; ideally, this level is used with the 50% level. The 50% retracement works so well because it is half of the price movement. It’s labeled as a psychological level in the market, and many traders from all over the world pay attention to it. Traders assume that the trend is over if the 50% level is broken.
78.6% Retracement: There are higher chances of a trend reversal at this level, and you should not make a pullback trade. Typically, When a candle closes below the 78.6% level, the probability of retracing to 100% is higher.
How to Draw Fibonacci Retracement
Drawing Fibonacci retracement levels is purely subjective. It simply involves drawing the retracements between two price points relevant to your trading strategy, depending on the timeframe you’re trading.
As we mentioned earlier, it can be dangerously easy to mistake a market reversal for a retracement – this is why you must first identify if the market is in a strong trend or not. This means identifying the most recent swing highs and swing lows.
Once you’ve identified the swing high and swing low, select the Fibonacci retracement tool and start from the swing low to swing high in a bullish market. In a bearish market, draw the Fibonacci retracement levels by starting from the swing high to the swing low.
When using the Fibonacci retracement strategy, the general idea is to go long around the Fibonacci support in a bullish market. Similarly, short the market around the Fibonacci resistance when trading in a bearish market.
Uptrend Fibonacci Retracement
When trading in an uptrend with the Fibonacci retracement tool, you first have to identify the lowest point of the bullish movement in the timeframe you’re trading – the swing low. And the second step is to locate the swing high. Note that the swing high and the low will always vary depending on your chosen timeframe.
Once you’ve identified these two points, draw the Fibonacci retracement tool starting from the swing low to swing high. This will automatically reveal the reference retracement levels of 100%, 78.6%, 61.8%, 50%, 38.2%, 23.6%, and 0%. These are the Fibonacci support levels; in this case, the 100% is at the swing low, and the 0% is at the swing high.

When trading an uptrend Fibonacci retracement, you can anticipate that the price will fluctuate from the most recent swing high and rebound from one of the Fibonacci support levels. And since we’re in an uptrend, these Fibonacci support levels can be used to set buy limit orders.
In the example above, the Australian Dollar futures retraced to the 38.2% Fibonacci retracement level twice before breaking out of the 0% level.
It’s impossible to know beforehand if the Fibonacci retracement levels will hold or if the market will reverse. That means you can set buy limit positions on the 23.6%, 38.2%, 50%, and 61.8% retracement levels; long positions will be opened whenever the price reaches these levels.
Alternatively, you can use the 0% Fibonacci level as the ultimate resistance. This means you buy if the price breaks above it. In this case, the profit target should equal the number of pips between the swing high and the swing low. You can set the stop loss around the 78.6% level.

Downtrend Fibonacci Retracement
In a bearish trend, you draw the Fibonacci retracement from the swing high to the swing low. In this case, the Fibonacci retracement levels serve as resistance, with the 100% level being the swing high and 0% being the swing low.
When trading the downtrend Fibonacci retracement, you can anticipate that the price will fluctuate from the most recent swing low and rebound from one of the Fibonacci resistance levels. In this example, the Euro FX futures retraced to the 68.1% Fibonacci retracement level several times before breaking out of the 0% level. Since we’re in a bearish trend, these Fibonacci resistance levels can be used to set sell limit orders.
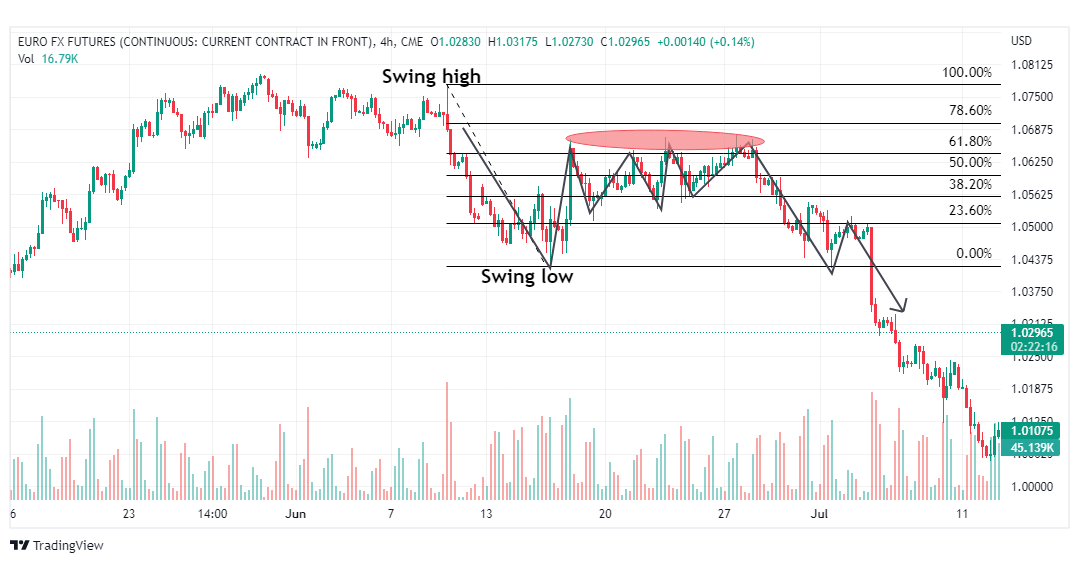
Alternatively, you can use the 0% Fibonacci level as the ultimate support. This means you sell if the price breaks below it, with the stop loss around the 78.6% level.

The Bottom Line
Fibonacci retracement levels indicate an asset’s support and resistance and are based on the Fibonacci ratios. These retracement levels are particularly useful when determining where to open or close a position or where to set limit orders. However, it’s worth noting that Fibonacci retracement levels are not foolproof. In principle, they only serve to identify areas of potential support and resistance, meaning there’s no guarantee that these levels will always hold. That’s why it’s advisable to use the Fibonacci retracement strategy with other technical indicators to confirm an asset’s momentum.
