

This guide will talk about the Fibonacci Moving Averages with the RSI indicator on the Light Crude Oil Futures.
We all know that market phases are cyclical. They increase, peak, drop, and fall to their lowest point. The end of one market cycle signals the start of the next.
So, to make better use of market cycles, why not try a combo of contrarian and trend indicators.
What is RSI?
First, let’s start with the indicators. The Relative Strength Index, or the RSI, is an oscillating indicator that assesses the momentum of an asset.
Traders use the indicator to determine if an asset is overbought or oversold. In addition, this data could be used to determine potential trading signals for entry and exit.
The relative strength index is a line graph that moves between two extremes and can range from 0 to 100.
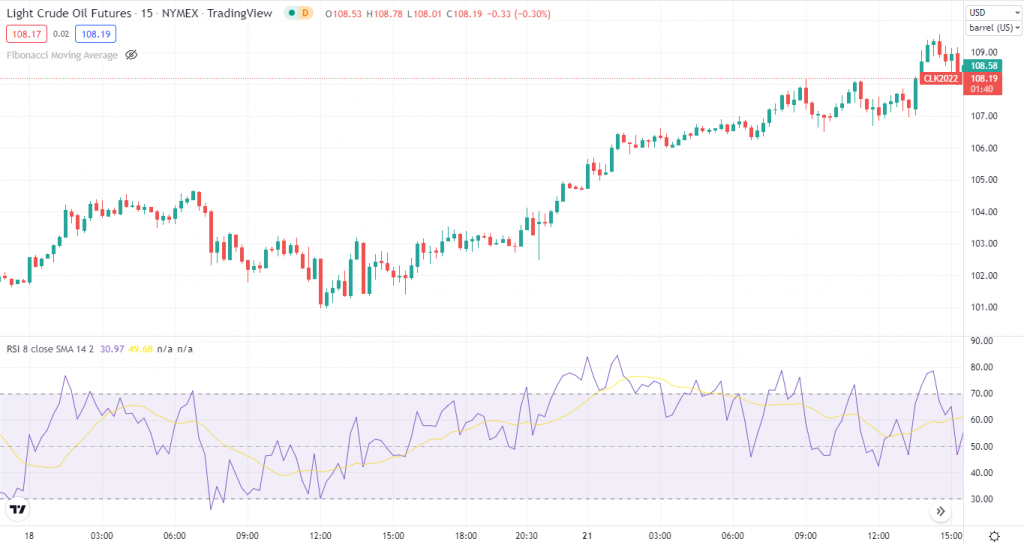
All readings above 70, according to a classic relative strength index, may suggest that an asset is overbought and is due for a trend reversal or retreat.
An RSI value below 30, on the other hand, may indicate that the item is being oversold and oversold. The overbought and oversold lines are the terms used to describe these lines.
In the video, we have further illustrated the RSI overbought and oversold levels.
What is the Fibonacci Moving Average?
The Fibonacci Moving Average indicator is a combo of Fibonacci and Moving Averages.
Moving Averages
The Moving Average is a technical indicator that compares the most recent price to the average price over a given timeframe to determine whether to buy or sell shares. The moving average smooths out daily price fluctuations and produces a historical price referencing trend.
They can be used to find support and resistance levels, stops and objectives, and comprehend the underlying trend.
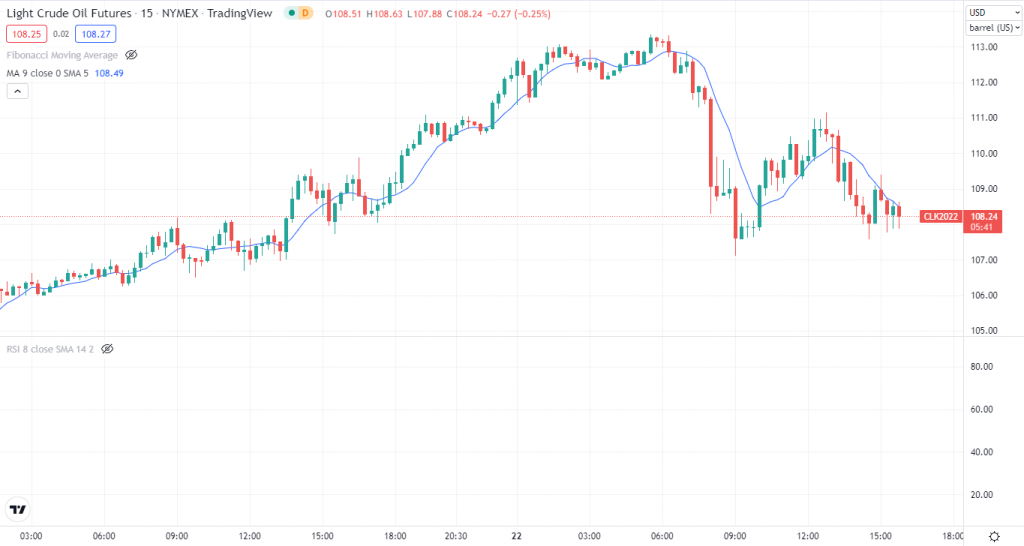
Traders can make and alter their judgments using a 20-minute time frame, 5-day moving average, and 50-day moving average.
There are two types of MA; exponential and simple.
The moving average is calculated using the simple moving average (SMA), a simple and uncomplicated method. It adds the five most recent daily prices together and divides them by five.
An exponential moving average (EMA) is a price computation over a set period that gives more weight to the most recent price data, allowing it to react to price changes more quickly.
Fibonacci
Technical analysts use Fibonacci to drive their opinion on buying and selling activity.
The renowned Fibonacci sequence, a set of numbers having features connected to many natural occurrences, is named after and derived from this technique. The numbers are discovered by adding the two numbers before them.
The series goes like 0, 1, 1, 2, 3, 5, 8, 13, 21………
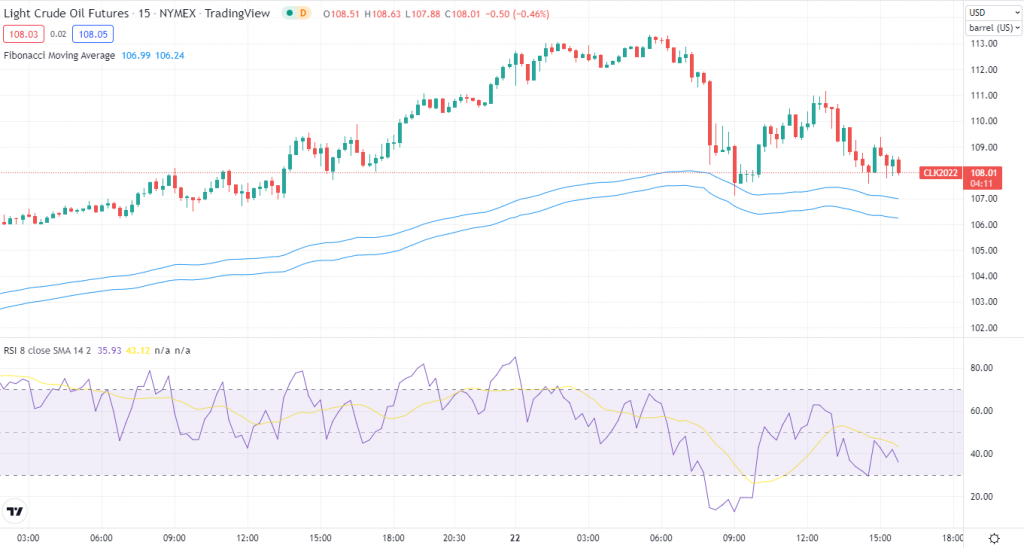
The Fibonacci Moving Average creates two types of 15 Exponential Moving Averages, each with a Fibonacci number as the lookback period that starts at 5.
We will compute periods 8 and 13 until we reach the 15th Fibonacci number and then divide the results of the 15th EMA by the number 15.
As a result, the Fibonacci Moving Average is generated on both highs and lows in most cases. As a result, we’ll average over the high and low prices rather than the close price. As a result, we have a moving zone.
You can find the Fibonacci Moving Average indicator on Tradingview’s list of indicators.
In the video, we have explained the calculation of the Fibonacci Moving Average more visually.
Now let’s move to our strategy.
Fibonacci Moving Averages and RSI strategy
Our strategy is on both ends of the spectrum. We mean it is a contrarian and a trend-following strategy. We are sort of in the grey zone as we expect a reaction from the Moving Averages and a continuation of the initial trend.
At the same time, we are using the RSI as a contrarian indicator. So, we are creating a hybrid strategy.
Trading rules
You can trade it in markets near the FMA by simply initiating a contrarian transaction. For example, if the market is falling and approaching the FMA, we can expect a bullish reaction in that area.
To trade with the Fibonacci Moving Averages and RSI, you have to follow certain rules:
Buy rules
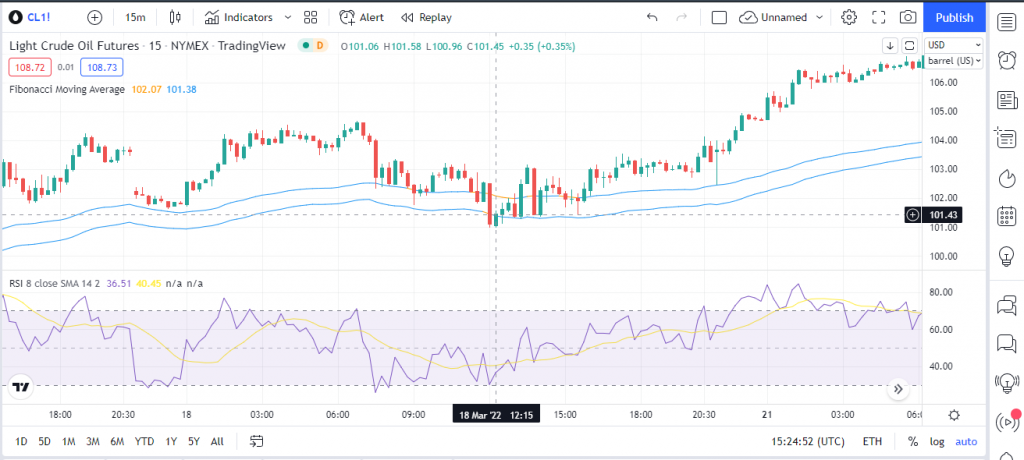
A buy signal pops up when the price is inside the Moving Average zone. The price should be above the lower Fib Moving Average and lower than the upper Fib Moving Average.
The RSI should have an eight period at or around 25. It suggests the price is touching the support level.
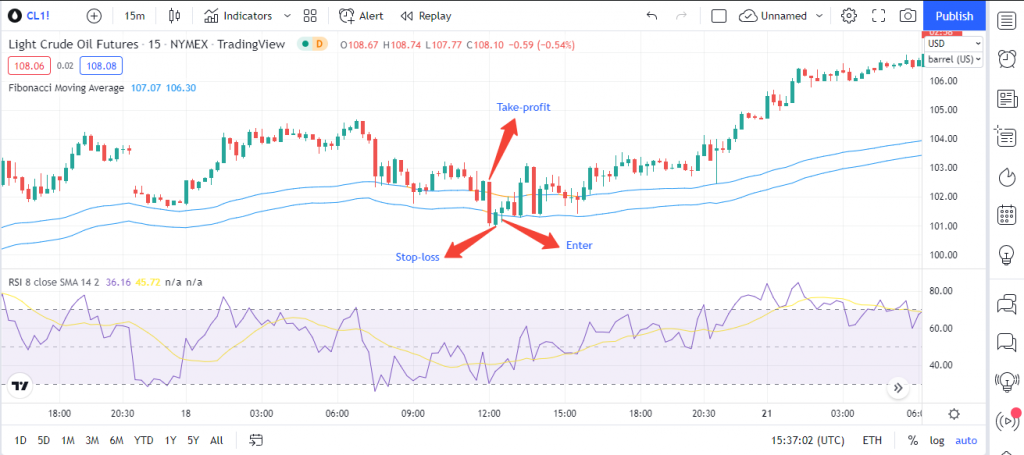
To enter the trade, we go long as soon as the price hits the Moving Average zone. However, the price has closed below the upper Fibonacci Moving Average and above the lower MA. Therefore, we take a position on the next bar.
The previous bar should close around 25.
You can set the take-profit order four times the difference between the two MAs on the close. You can see on the chart below that the upper Moving Average is 102.07 and the lower one is 101.38. The difference between the two is projected four times above the open price of the trade. So, the trade’s opening price multiplied by 4 gives us our TP.
For Stop-loss, we follow the same rules as TP, except that we multiply it by two and subtract it from the opening price.
The SL gives us a 2.0 risk/reward ratio in the strategy.
In the video, we have explained buying rules with proper calculations.
Sell rules
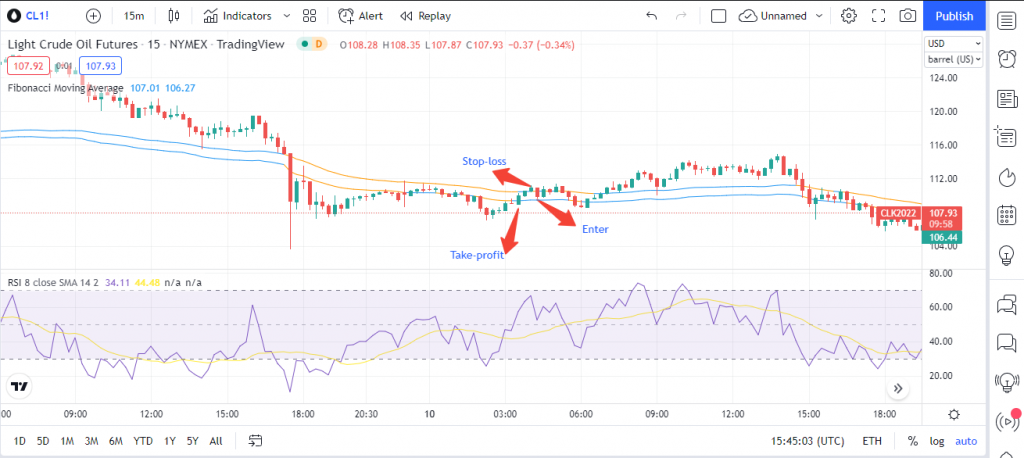
Like the buy signal, a sell signal surfaces when the price is inside the Moving Average zone. The price should be above the lower Fib Moving Average and lower than the upper Fib Moving Average.
The RSI should have an eight period at or around 60. It means the price is touching the resistance level.
We go short as soon as the price hits the Moving Average zone to enter the trade. It means that the price has closed below the upper Fibonacci Moving Average and above the lower MA. Then, we take a position on the next bar.
The previous bar should close around 60
You can set the take-profit order four times the difference between the two MAs on the close. The difference between the two is projected four times above the open price of the trade. So, the trade’s opening price multiplied by 4 gives us our TP.
For Stop-loss, we follow the same rules as TP, except that we multiply it by two and subtract it from the opening price.
The SL gives us a 2.0 risk/reward ratio in the strategy.
In the video, we have demonstrated the sell rules with proper calculations.
Fibonacci Moving Averages & RSI Trading Strategy VIDEO
Final thoughts
So, there you have it! Now you know the Fibonacci Moving Average and the RSI strategy. The strategy works best on every timeframe, but it’s more suitable on lower timeframes like the 15min. Also, it gives us SL and TP with proper calculations, so it takes the guessing game out of the equation.

