In technical analysis, double top and bottom are chart patterns that predict market trends. Hence, it is not uncommon to find double tops and bottoms on the charts of financial instruments.
Double tops signify the end of a bullish trend, whereas double bottoms indicate a possible bearish trend reversal. Chart patterns such as double tops and bottoms may help traders formulate their technical analysis strategies, though they may not forecast trend reversals with accuracy. Nevertheless, traders use such patterns to aid in their trading decisions.
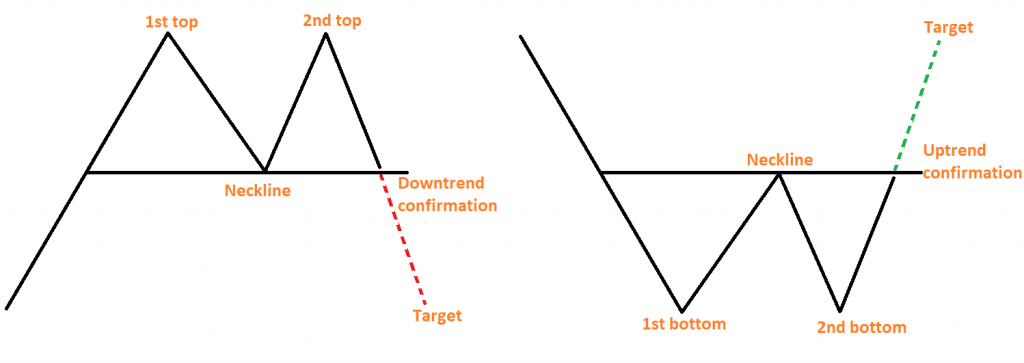
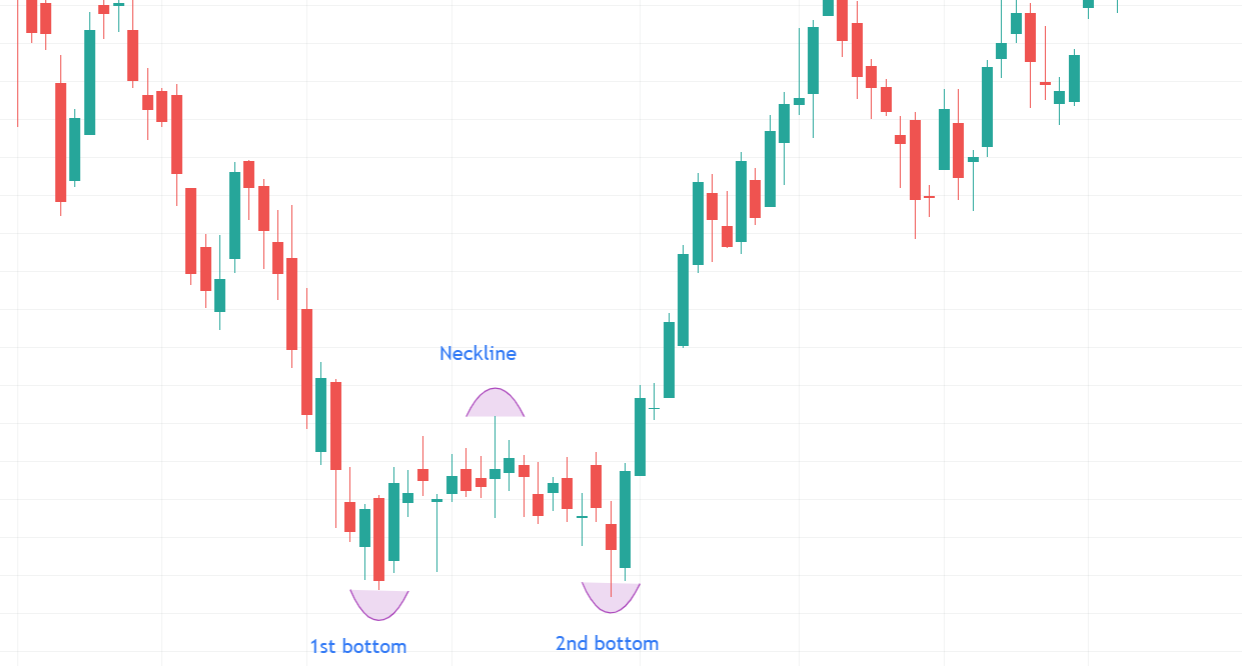
Double top and bottom illustration
Our objective for this article is to find out the logic behind double tops and bottoms. We will also discuss how to spot them on the price charts and use them in futures trading.
What is a double top?
A double top pattern consists of two high points in a market which indicates the reversal of a bullish trend ahead. It assumes that the price will decrease gradually between the two high points. Further, it will show some resistance around the highs. As a result, the market retraces a portion of the first peak just before rallying back to the high of the first peak. However, the trading market is volatile and cannot sustain an above-the-first peak break.
The price may break the first top by a few points on lower timeframes. However, the double top pattern remains valid if that break is temporary and results in a price drop. It indicates that the second top has been formed.
You can see a neckline that will occur between the two higher peaks. We are in for a double top when this neckline breaks below the price. The downtrend is confirmed if the price breaks the neckline support.
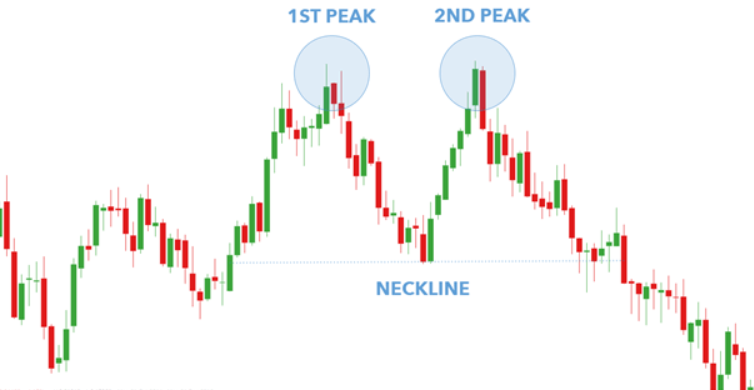
Example of the double top pattern
How can you find out the double top patterns on charts?
Here is a step-by-step guide to identifying this chart pattern.
- You should be able to separate two specific peaks of similar width and height.
- Peak distances should not be too small – this depends on the timeframe.
- Price support/neckline confirmation
- Other technical tools, such as MAs and oscillators, may be used for confirmatory analysis.
For Example
Considering the following 15-minute chart of Nasdaq futures (NQ), we can see how bearish reversals occur after a double top forms at the peak of an uptrend:
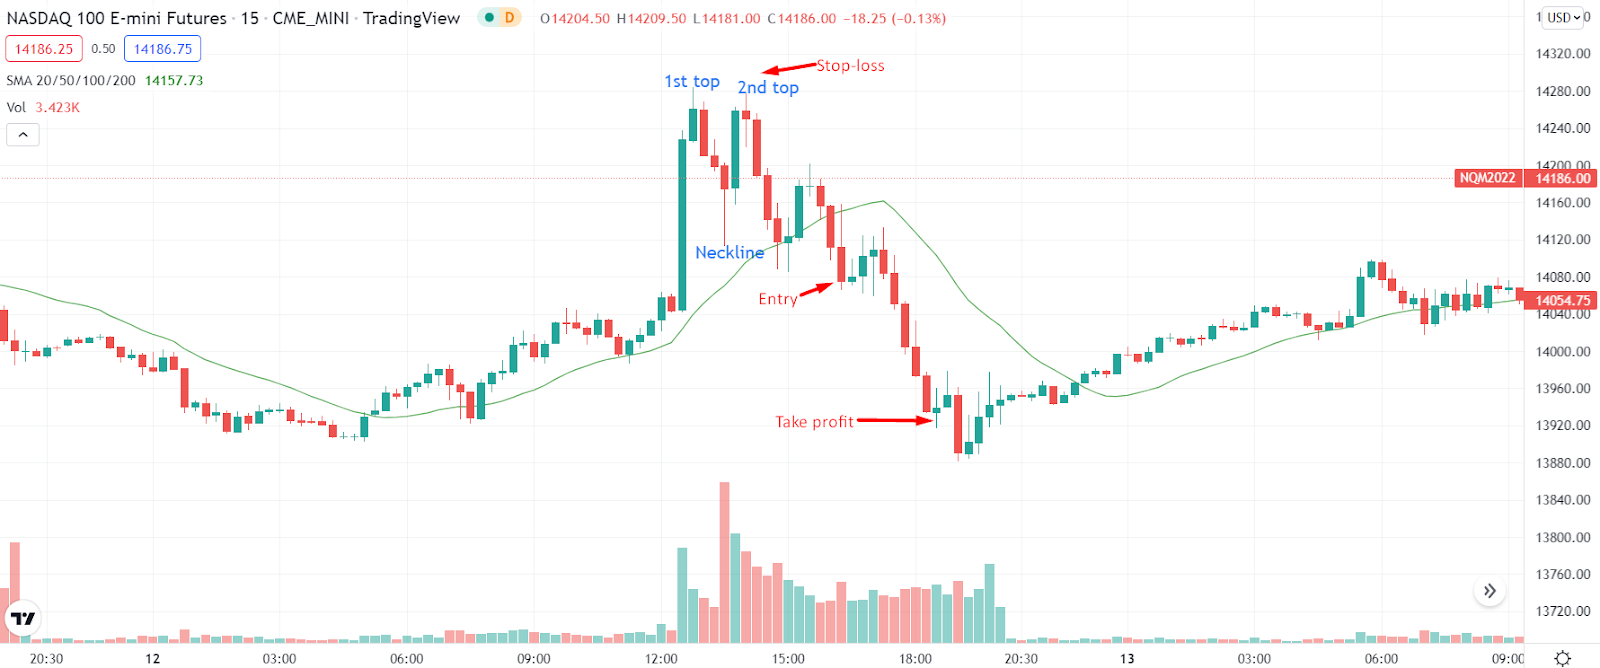
Example of double top trading pattern
Stop loss:
A stop-loss can be placed above the double-top pattern.
Profit target:
The profit target should equal the distance between the entry point and stop loss. Ideally, you may aim for a 1:1 risk-to-reward.
What is a double bottom?
Double bottoms occur when two low points form at the same horizontal level and signal a possible bullish reversal. As the price rises between these common points, some support appears at the price lows.
Chart patterns with double bottoms are often found near the end of downtrends and resemble the letter “W” (see below).
The price drops and forms a new low. Then, it attempts to rise but fails at a certain level (neckline resistance) and returns to lows. However, the price does not move below the initial low and sharply bounces off. This is the double bottom pattern. The bullish trend is confirmed when the price breaks above the neckline resistance.
Example of a double bottom pattern
The double bottom is a common pattern that typically appears on charts. The key is to wait for the neckline resistance to break before taking a position. Patience is very important because your winning position might result in losses if you make a hasty decision without waiting for confirmation (i.e., Neckline break)
How to identify a double bottom pattern?
A step-by-step guide to identifying the double bottom pattern on a chart:
- You should be able to identify two distinct bottoms with similar widths and heights
- Bottoms should not be too far apart – depending on the timeframe
- Confirm resistance/neckline levels
- Besides moving averages and oscillators, other technical indicators can also be used to add a higher probability of success
For Example:
We can see in the example of the gold futures daily chart below how a bullish reversal takes place after the formation of a double bottom at the end of a downtrend cycle:
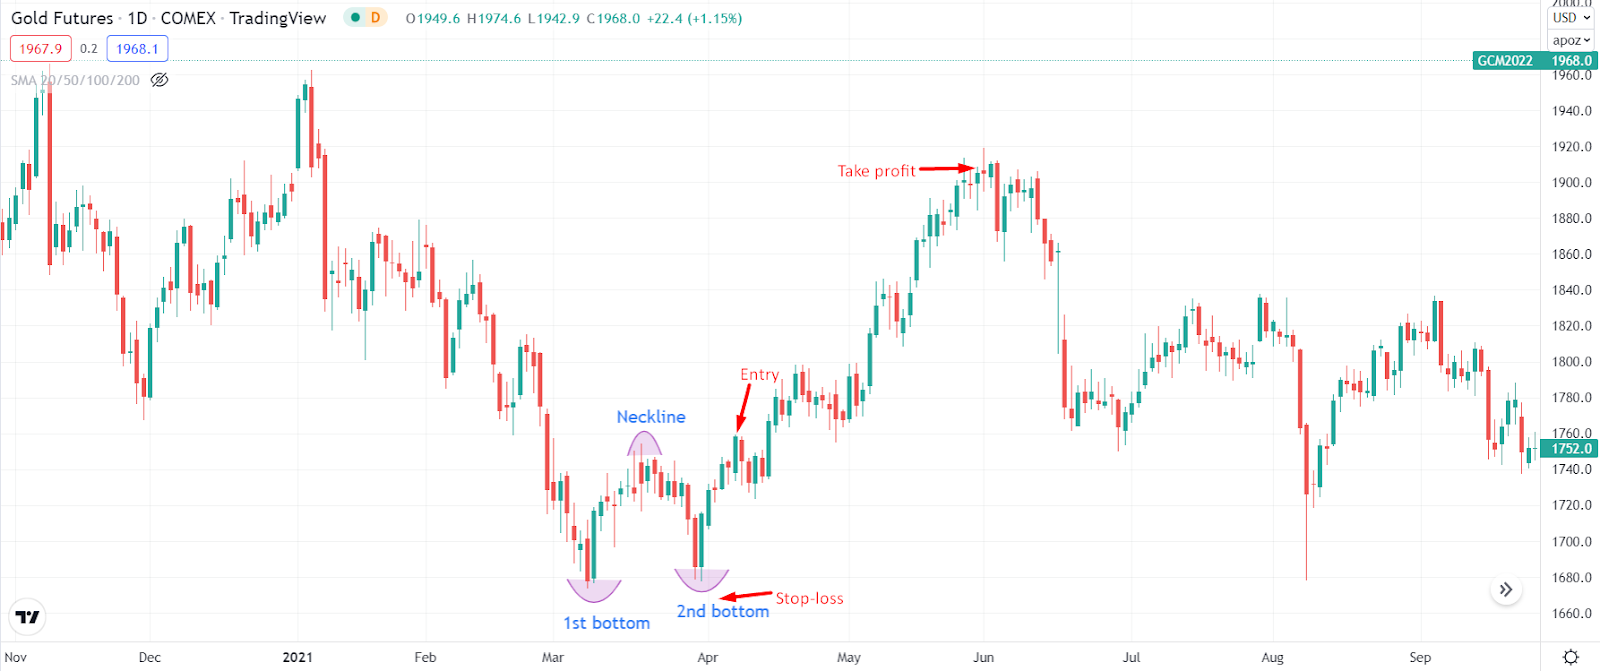
Example of double bottom pattern with entry and exit
Stop loss:
Double Bottom chart patterns should have stop loss placed below the second bottom of the pattern.
Profit target:
Ideally, the price target should also equal the distance between the neckline and the bottom.
What do the double bottom and double top tell traders?
These patterns warn traders of potential trend reversals. In both cases, the trend will reverse after forming the second peak or second bottom. However, the reversal is confirmed when the price breaks the neckline support/resistance.
Similarly, as with several other technical guides, the double-top and double-bottom patterns cannot be considered definitive trend reversal indicators. However, you can use chart patterns like double tops and double bottoms to confirm the trend in conjunction with different technical indicators.
Double top and bottom in futures trading
These patterns work the same way in futures trading and other financial markets. It would be best to keep in mind that most markets are open 24 hours a day, five days a week. However, the most intense price action and volatility occur during the London and New York sessions.
When major global exchanges/sessions are closed, the price tends to be jerkier. The sideways movement can offer the impression of multiple double tops and bottoms. You will see the double top and bottom patterns and even the neckline breakouts during the low volatile market hours. But such patterns are not considered reliable, especially when formed in the lower time frames.
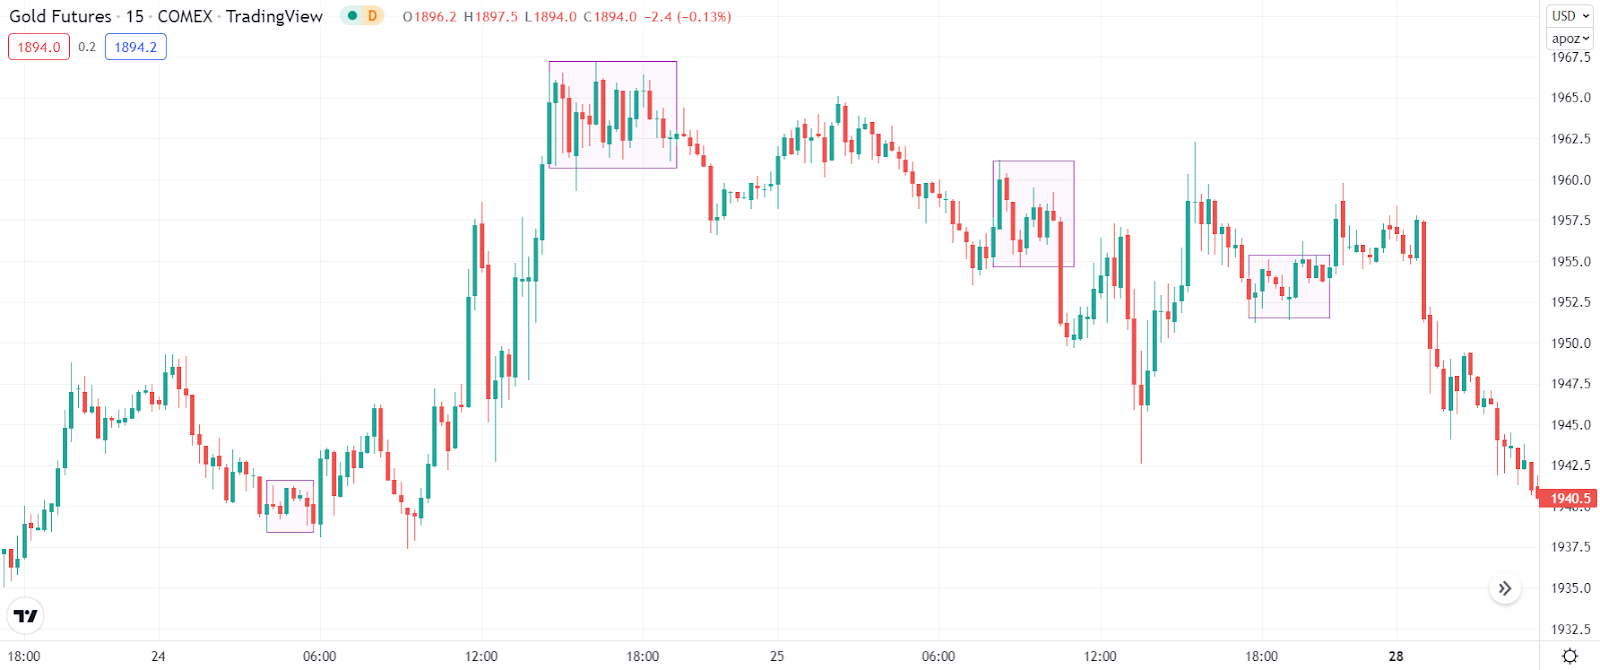
Failed double top and bottom during low volatility
Double top and bottom in stocks
You can trade stocks and stock indices using double tops and bottoms. However, fundamental analysis can overshadow the double top or bottom pattern in some cases due to its dramatic impact on the share price.
This category includes changes in company structure and earnings reports. It may form a double bottom on a price chart, causing a stock to look appealing for trading. However, the price may drop if a poor earnings report is released, regardless of the double bottom pattern. Therefore, you should take extra precautions when trading around earnings reports.
How to start trading with these patterns?
Trading with double tops and double bottoms can be done in two ways: you can open a short position when a double top appears or a long position when a double bottom appears. In the meantime, you should confirm the signal using different technical indicators, such as the RSI or the parabolic SAR – both of which are momentum indicators.
You can further practice the double top and bottom trading strategy to take full command of it. Then, with the help of an effective trading strategy, you can showcase your trading skills on the OneUp Trader evaluation program. OneUp Trader guarantees you a funded account with one of their funding partners when you pass their evaluation.
Sign up for an evaluation account here.
To trade a double bottom or double top, you must follow these steps:
- Wait for the neckline breakout before entry.
- Look for at least 1:2 RRR.
- Use any other indicator like RSI, PSAR, etc., for additional confirmation.
- Perform multiple timeframe analyses.
Limitations of Double Tops and Bottoms
Identifying double top and bottom formations correctly is essential for successful trading. However, misinterpreting them can lead to trading losses. To avoid this, one must exercise extreme caution before jumping to conclusions.
A failed double top is significantly different from the accurate double top pattern. A stock or asset is vulnerable to a sharp decline in an actual double top, often when a technical pattern is highly bearish. When it comes to confirming a double top’s identity, however, being patient and identifying the critical level of support is essential. It is possible to assign a false reading to the formation of a double top in trading based only on the appearance of two consecutive peaks.
Final thoughts
A double bottom or double top is a trend reversal pattern. A bearish trend turning bullish or a bullish trend turning bearish can be determined by looking at either of these chart patterns.
When the second peak of a double top appears, traders will place a short position. Long positions appear when the second low of a double bottom occurs.
Neither pattern is confirmed until the price breaks the neckline. If it does not, then neither is valid. When trading, you can use double tops and bottoms to find entry points, stop-loss locations, and profit targets. This reduces the risk involved in a trade. Our trading platform can search for patterns manually or automatically using automated software.
Double tops and bottoms should always be used together with other indicators, like volume, to confirm the reversal before taking a position.
For more insights into different trading chart patterns, check out our blog on the most popular chart patterns and how to read them.