

Any price action has a series of steady bullish and bearish trends punctuated by momentary price consolidation. When timed accurately, breakout trading strategies can be invaluable for catching trends while they’re just beginning. And this is what the rising and falling wedge chart pattern trading is geared towards.
What are Wedge Chart Patterns?
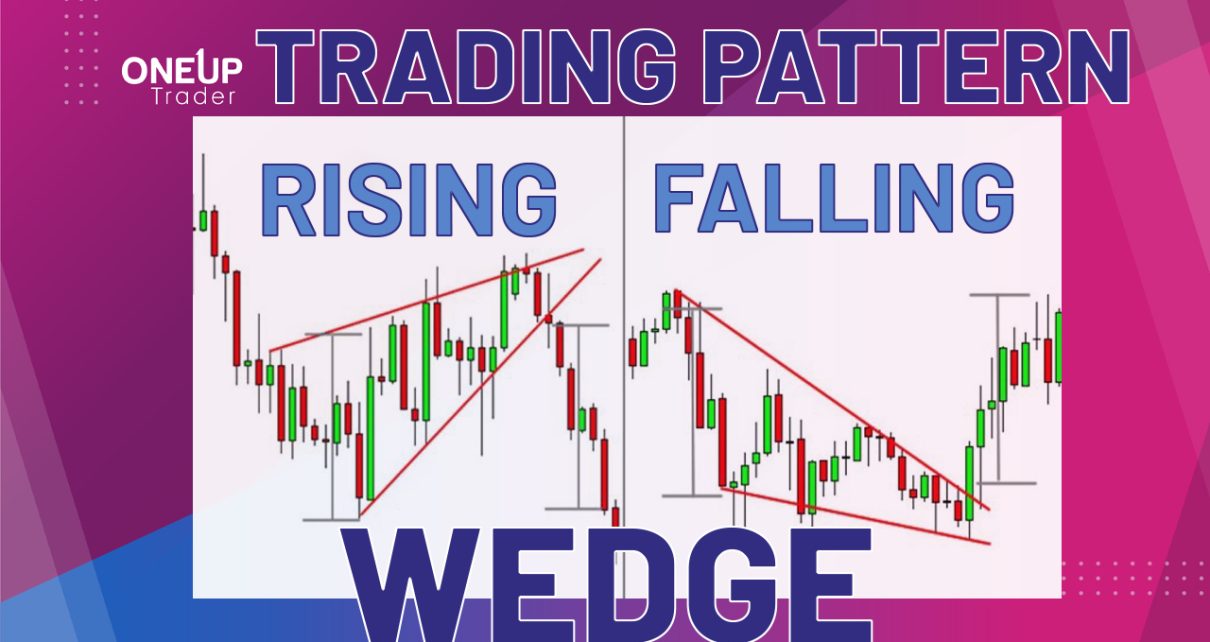
A wedge is a chart pattern formed by converging two trendlines. Wedges usually form when an asset’s price consolidates after a sustained bullish or bearish trend. Rising and falling wedge chart patterns form when an asset’s price consolidates between two converging trendlines. These converging lines represent rising support and rising resistance.
Wedges can be continuation or reversal chart patterns depending on how they are formed on a chart. Both rising and falling wedge chart patterns have three common characteristics. Firstly, the price action has converging upper and lower trendlines. Secondly, the volume traded is generally low within the wedges; and thirdly, there’s always a breakout from either of the trendlines.
What is a Rising Wedge Chart Pattern?
The rising wedge pattern is a bearish chart pattern formed when the price is constrained within two upward-sloping and converging trendlines. In this case, the support trendline is usually steeper than the resistance.

This chart pattern can occur in an uptrend or a downtrend; in both instances, its formation precedes a bearish trend.
Rising Wedge Reversal Chart Pattern
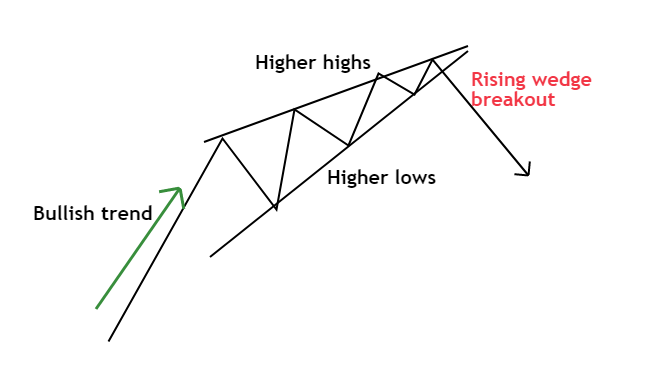
A rising wedge chart pattern in an uptrend forms when the price hits higher lows and higher highs. It is a bullish to bearish reversal chart pattern.
You can identify a rising wedge chart pattern under these conditions:
- The market has to be in an uptrend, which is followed by price consolidation
- The asset forms higher lows, and a rising trendline can be drawn connecting them. The higher lows tend to be steeper than the higher highs.
- The trendlines linking the higher highs and the higher lows converge towards a narrow end.
Rising Wedge Continuation Chart Pattern
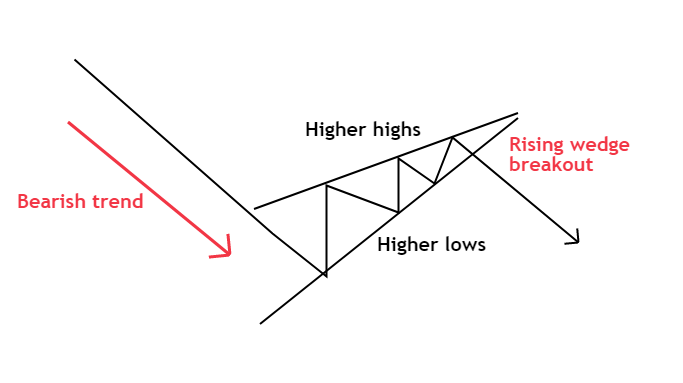
A rising wedge pattern in a downtrend is a bearish continuation chart pattern. It forms when the price action attains higher highs and higher lows in a bear market.
When a rising wedge chart pattern forms in a downtrend, it implies a short-term price pullback. Since this pullback is punctuated by low trading volume and diminishing price momentum, it shows that the price may continue with the previous downtrend.
The rising wedge pattern in a downtrend is similar to a rising wedge in an uptrend. The only difference is that the former appears in a bearish market.
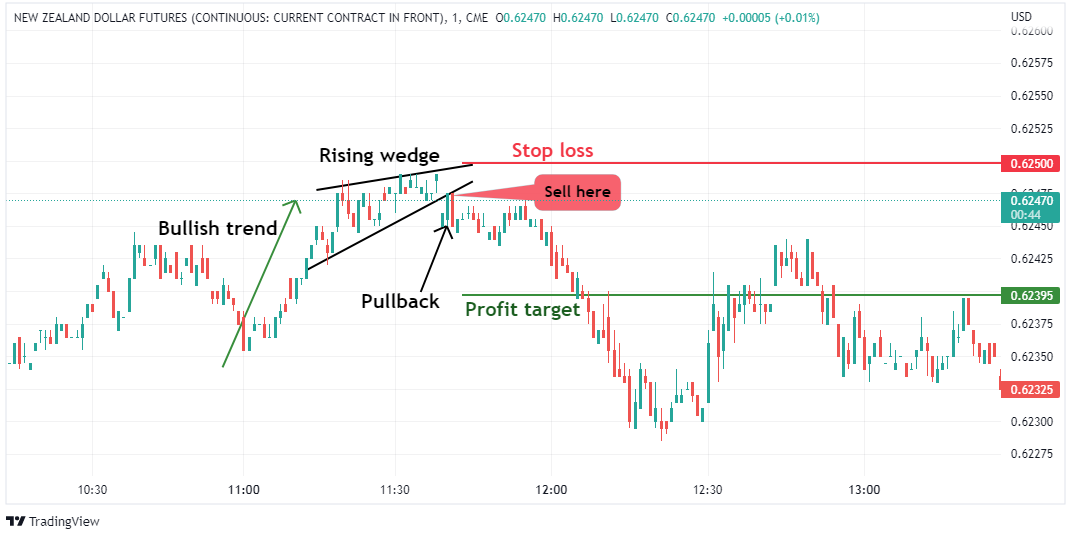
How to Trade a Rising Wedge Chart Pattern
Ideally, the formation of a rising wedge chart pattern precedes a bearish breakout. The rationale behind this pattern is that although the price action is trending upwards, it is contracting, indicating that the upward momentum is waning. Typically, this slowing momentum is often accompanied by a drop in the volume traded.
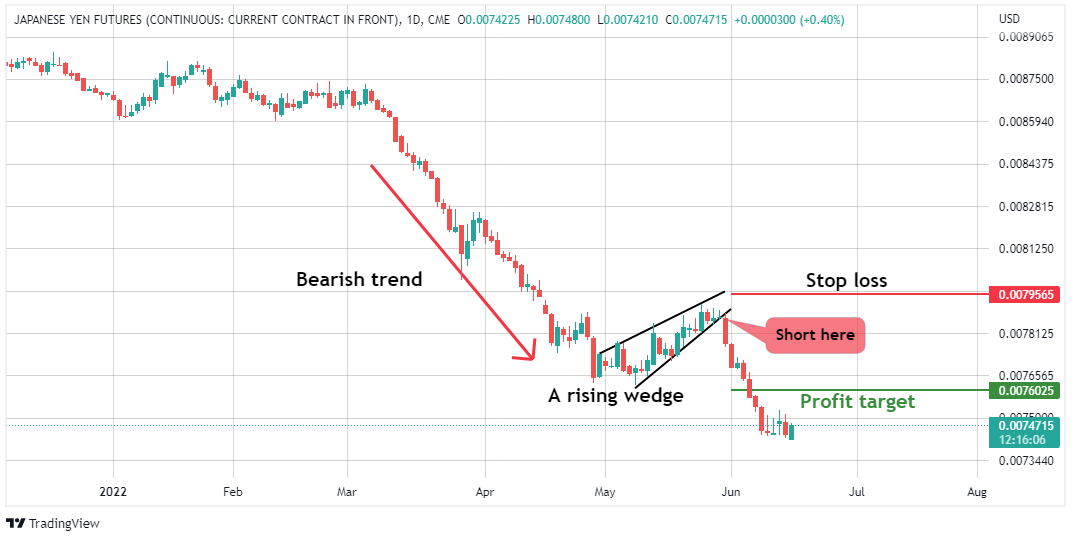
Ideally, you can trade a rising wedge pattern by shorting when the price breaks below the support line. A bearish reversal occurs when the price breaks below the support of a rising wedge pattern in an uptrend. And if the price action drops below the support of a rising wedge pattern in a downtrend, you have a bearish continuation.
When trading the rising wedge chart pattern, the stop loss is usually placed at the highest point of the upper trendline. Ideally, the profit target should be equivalent to the highest and lowest points of the wedge.
Alternatively, you can wait for the price to pull back after the breakout before shorting the market. This approach is designed to prevent any premature market entries. When the price breaks below the support line, that support becomes resistance; in this case, you wait for it to pull back to this resistance (the previous support of the rising wedge). Open a short position if the price fails to break above the resistance.
In either scenario for the rising wedge chart pattern breakout, watch out for a spike in the volume traded. This is usually a good indicator of potential larger price swings. You may also consider using other technical indicators to determine if the asset is overbought. This can be used as confirmation of an impending rising wedge breakout.
What is a Falling Wedge Chart Pattern?
The falling wedge chart pattern is a bullish pattern formed when the price action bounces between two downward-sloping and converging trendlines. It is considered the direct opposite of the rising wedge chart pattern. And although both the support and resistance trendlines point downwards, the resistance is steeper.
This chart pattern can occur in an uptrend or a downtrend; in both instances, its formation precedes a bullish trend.
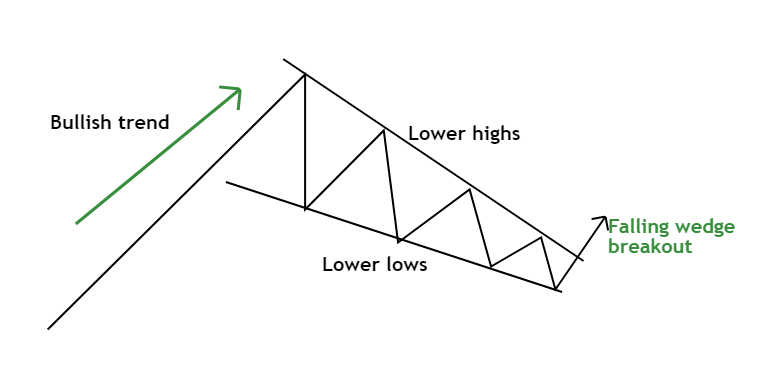
Falling Wedge Continuation Chart Pattern
As we mentioned, falling wedges are bullish chart patterns. A falling wedge continuation pattern forms when the falling wedge occurs in a bullish trend, with the price hitting lower highs and lower lows.
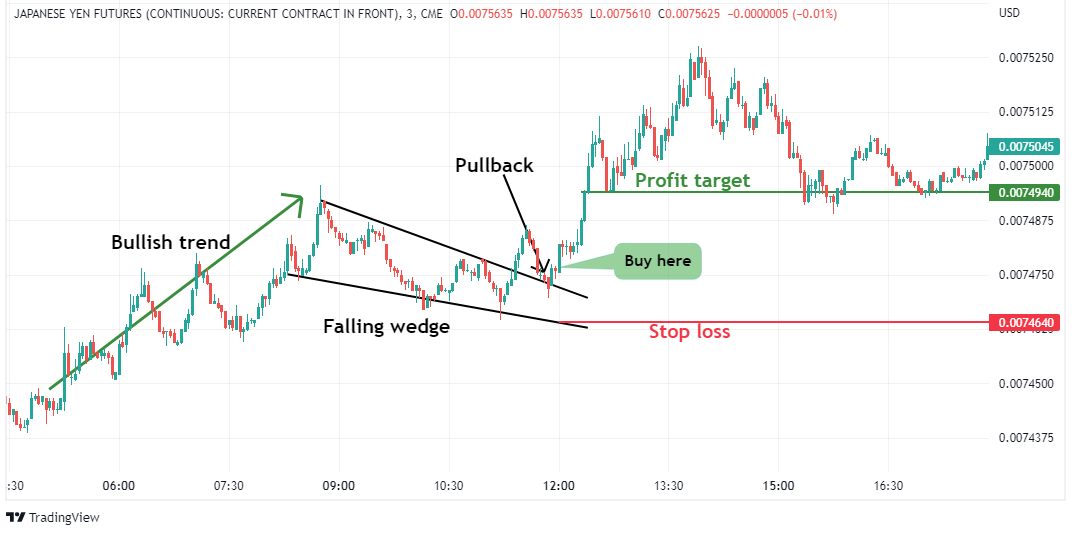
When this pattern forms in an uptrend, it occurs as a pullback – it looks like a minor bearish correction in a dominant bullish trend. You can identify a falling wedge chart pattern in an uptrend under these conditions:
- The market has to be in an uptrend, followed by price consolidation
- The asset forms lower lows and lower highs, and a downward trendline can be drawn connecting the lows and the highs. In this case, the lower highs tend to be steeper than the lower lows.
- The trendlines linking the lower highs and the lower lows converge towards a narrow end, indicating that the price momentum is waning.
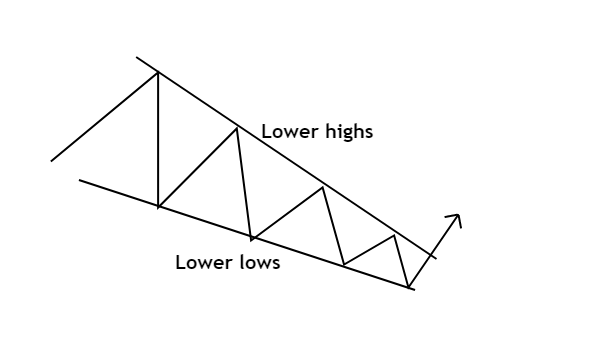
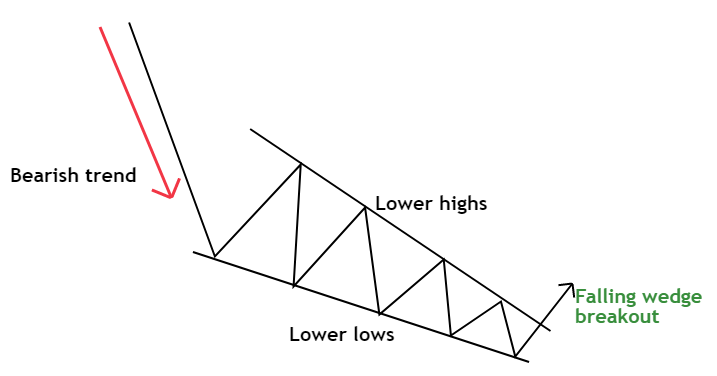
Falling Wedge Reversal Chart Pattern
A falling wedge pattern in a downtrend is a bearish to bullish reversal pattern. It forms when the asset hits lower highs and lower lows in a bear market. This pattern usually appears on swing lows, which means that the bearish momentum is weakening, and a bullish reversal is imminent.
Note that the process of identifying a falling wedge chart pattern in a downtrend is similar to that of a falling wedge in an uptrend. The only difference is that the former appears in a bearish market.
How to Trade a Falling Wedge Chart Pattern
The formation of a falling wedge pattern usually precedes a bullish trend. Although the pattern is in a downtrend, the contracting price action implies that this downtrend is losing momentum. And generally, its formation is accompanied by a drop in the volume traded.
Since the falling wedge is a bullish chart pattern, entry positions usually coincide with falling wedge breakouts. This is when the price breaks above the upper trendline of the falling wedge.
A bullish continuation occurs when the price breaks above the falling wedge chart pattern in an uptrend, and a bullish reversal occurs with a falling wedge breakout in a downtrend. In both scenarios, you buy immediately after the price breaks above the upper trendline (the resistance).
Ideally, the profit target should be equivalent to the distance between the falling wedge’s highest and lowest points. And you should set the stop loss at the lowest point of the falling wedge.

To avoid potential false breakouts, it’s advisable to wait for a price pullback after the falling wedge breakout. Typically, after a falling wedge breakout, the upper trendline of the wedge becomes the support. You should open a buy position if the price pulls back to this support and fails to breach it.
When trading the falling wedge pattern breakouts, watch out for the increase in volume being traded. Remember that this chart pattern forms during price consolidation and is often characterized by lower volume traded. So, a spike in the volume is usually a reliable indicator of impending large price swings. Note that you can also use technical indicators to determine if the asset is oversold.
The Bottom Line
Ideally, wedge chart patterns are both continuation and reversal patterns depending on the prevailing market trend. A rising wedge in an uptrend is a bearish reversal chart pattern, while a rising wedge in a downtrend is a bearish continuation pattern. Conversely, a falling wedge in an uptrend is a bullish continuation chart pattern, while a falling wedge in a downtrend is a bullish reversal chart pattern.
For more insights about market indicators and chart patterns, check out our blog on the most popular chart patterns and how to read them.


