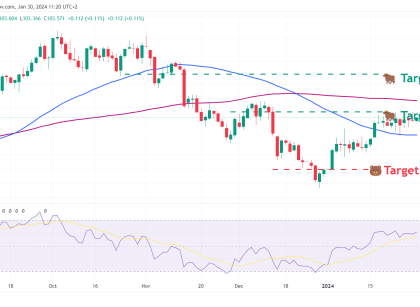
Weekly Chart Analysis: Looking at the weekly chart, we observe that Light Crude Oil Futures have recently bounced off a consolidation zone around the $74.88 level, indicating a potential bullish breakout. Last week’s candlestick closed above this zone, and this week’s candle is turning green already. A sustained hold above $74.00 could see us targeting Read More…
Technical Analysis
Bulls in full control as S&P 500 (ES) Surges
Weekly Chart Analysis: The price of ES has made a significant move by closing above the all-time high (ATH), which suggests a strong bullish bias. We see a clear break above the previous resistance level, which bulls want to see serve as support in any potential retest. If you’re looking for a bullish confirmation of Read More…
Gold futures (GC) MACD bearish, but POC bullish
Weekly Chart The weekly chart shows how significant the false break has been in GC with bulls still unable to push through. The recent ‘Failed Attempt’ to break above this level is beginning to show signs of exhaustion from the bulls. Immediate support is seen at the rising trendline, currently near the 1974.4 mark. A Read More…
Euro FX futures (6E) technical analysis trades both directions
Weekly Chart Analysis: The weekly chart exhibits a consolidation pattern with a clear ‘Point of Control’ at approximately 1.09220. This level represents the price with the highest volume traded over the analyzed period and acts as a significant area of balance between supply and demand. The presence of a ‘Low Volume Node’ below this range Read More…
Bullish price action in Dollar (DXY)
Weekly Chart We observe a clear support zone around the 102.00 level, which price is currently testing. If we see a strong bullish response at this zone, we could anticipate a rally towards the upper resistance near 114.90. However, a break below this support could lead us to look for further downside targets near the Read More…
Frightening evening star pattern on RTY futures
Weekly Chart Starting with the weekly chart, the E-Mini Russell 2000 Index Futures are oscillating within a defined trading range between approximately $1964.5 and $2000, with the ATH at $2463.7. The index is currently testing the upper boundary of this range. A convincing breakout above the range could signal a strong bullish sentiment, potentially targeting Read More…

