


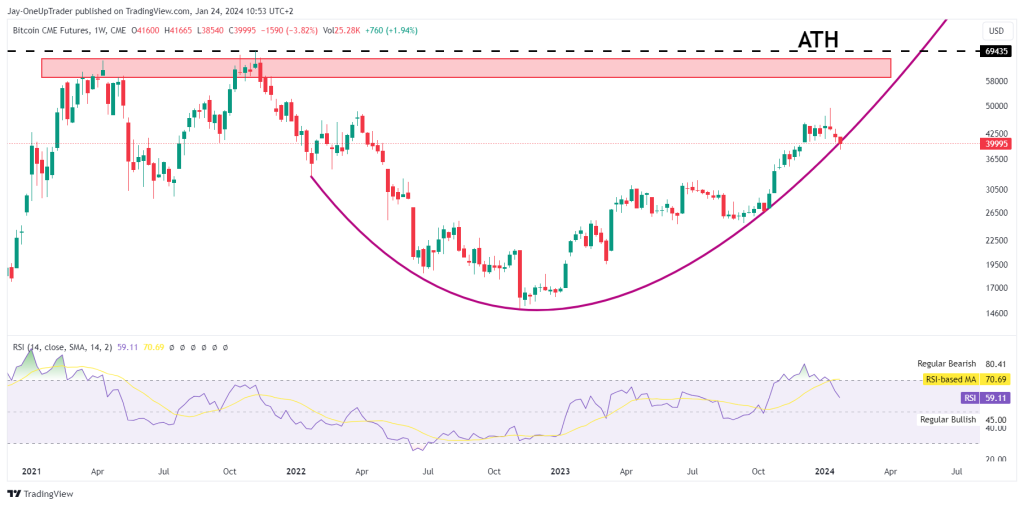
Weekly Chart Analysis:
Price has formed a large rounding bottom pattern and parabolic curve, typically considered a bullish reversal signal. The price was approaching the all-time high (ATH) resistance zone, near $69,435, before swiftly pulling back after greyscale started dumping on the market. We should monitor this level closely; a decisive weekly close above the ATH would mean we are in the midst of the next BTC bull cycle in the year of the halving event. The RSI is also now moving into neutral territory after being severely overbought from most of Q4 last year.
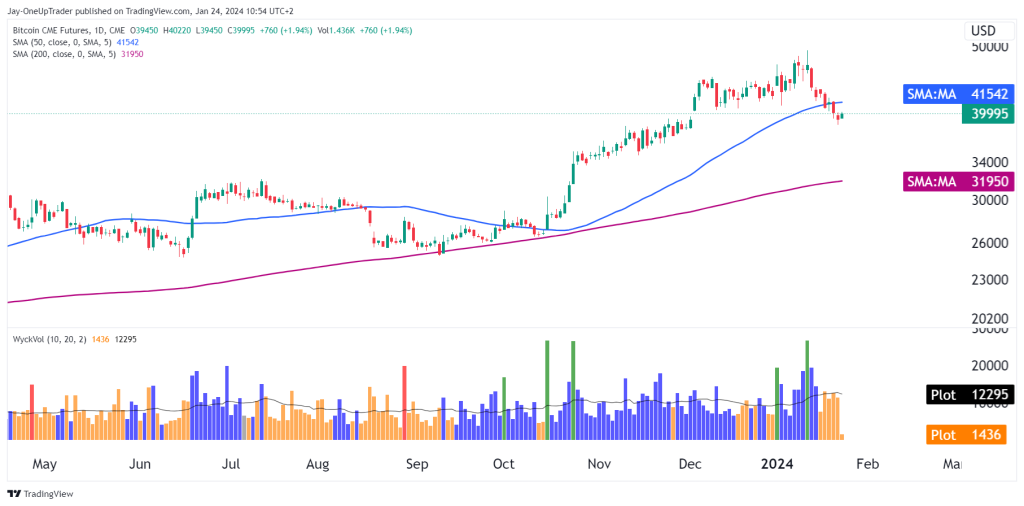
Daily Chart Analysis:
The daily chart shows the price hovering around the 50-day Simple Moving Average (SMA) at $41,542. The 200-day SMA lies beneath, around $31,950, which could act as strong support if a retracement occurs to that deep level. Wyckoff volume shows a big spike in volume at the peak of the uptrend which is usually the euphoria that traders should take profit into. This represents the investors that are entering into FOMO and chasing green candles higher.
15-Minute Chart Analysis:
On the 15-minute Heikin Ashi chart, which smooths price action, we see a trend of higher lows indicating short-term buying pressure. The Heikin Ashi candles are mixed, showing some indecision at the moment. The SuperTrend indicator provides resistance at approximately $40,124 and support at $39,955. A break above the SuperTrend resistance could suggest an intraday bullish bias, while a drop below $39,955 might signal short-term bearishness.

Levels to Watch:
- Resistance 1: ATH near $69,435 (critical for long-term bullish confirmation)
- Support 1: $41,542 (aligning with 50-day SMA on the daily chart)
- Support 2: $39,995 (immediate support level which could sustain bullish sentiment)
- Resistance 2: $40,124 (short-term resistance on the 15-minute chart)
Trades to Take:
For aggressive traders:
- Enter a long position if there’s a clear break and close above the $40,124 resistance on the 15-minute chart. Stop loss could be placed below $39,955 with a target at the next resistance level.
For conservative traders:
- Wait for this weekly close to indicate some buying pressure is present, then slowly accumulate into a long-term position with the idea that prices will eventually break above the all-time high. Stops can be set at $24,850 for this type of trade or below this week’s close for tighter risk management.
Rating:
The overall rating based is Bullish. The rounding bottom on the weekly chart indicates a significant reversal pattern, and bulls want to see the parabolic curve hold. Daily price action is testing the 50-day MA and would be a plus if it holds as support, but it is not completely necessary.
Remember, while the current setup appears bullish, it’s essential to remain vigilant for any signs of reversal and adhere strictly to risk management practices. Keep aware of recent events, as big whales and institutions seem to want to offload their BTC.
