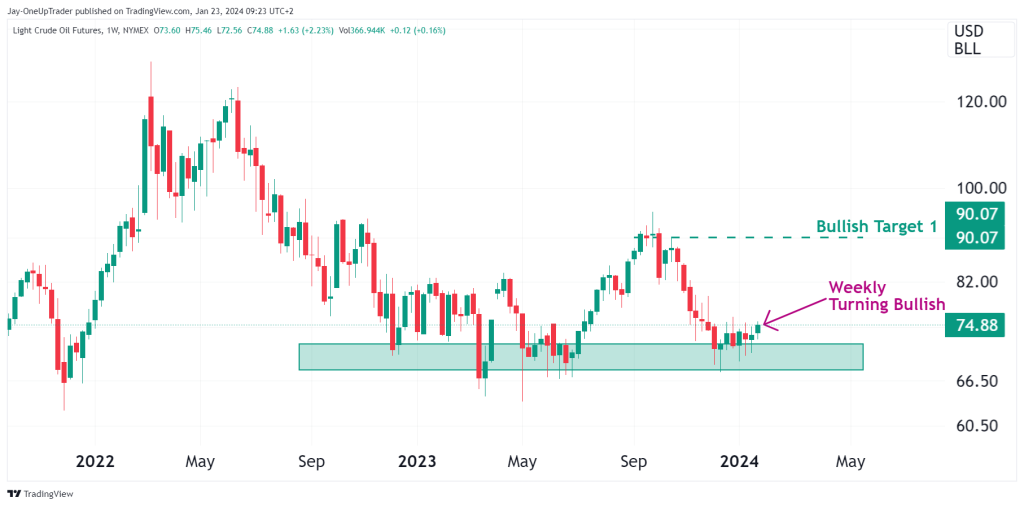
Weekly Chart Analysis:
Looking at the weekly chart, we observe that Light Crude Oil Futures have recently bounced off a consolidation zone around the $74.88 level, indicating a potential bullish breakout. Last week’s candlestick closed above this zone, and this week’s candle is turning green already. A sustained hold above $74.00 could see us targeting the $90.07 resistance level in the medium term. However, it’s important for us to monitor whether the bulls can maintain control and keep the price above this support level.
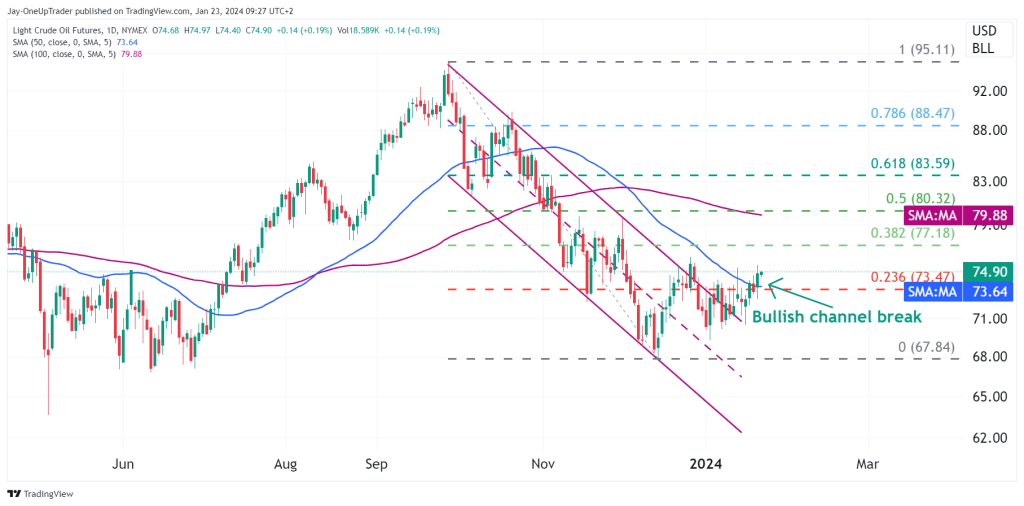
Daily Chart Analysis:
The daily chart shows a bullish channel break, with the price closing above the 50-day moving average. This is a bullish indicator for us. We also note that the price has broken through the descending channel resistance, which could potentially lead to further upside. The Fibonacci retracement levels from the recent swing high to low show that the price has surpassed the 0.236 level at $73.47, and the next level for us to watch is the 0.382 level at $77.18. A break above this could open the door to the 0.5 and 0.618 levels at $80.32 and $83.59, respectively.
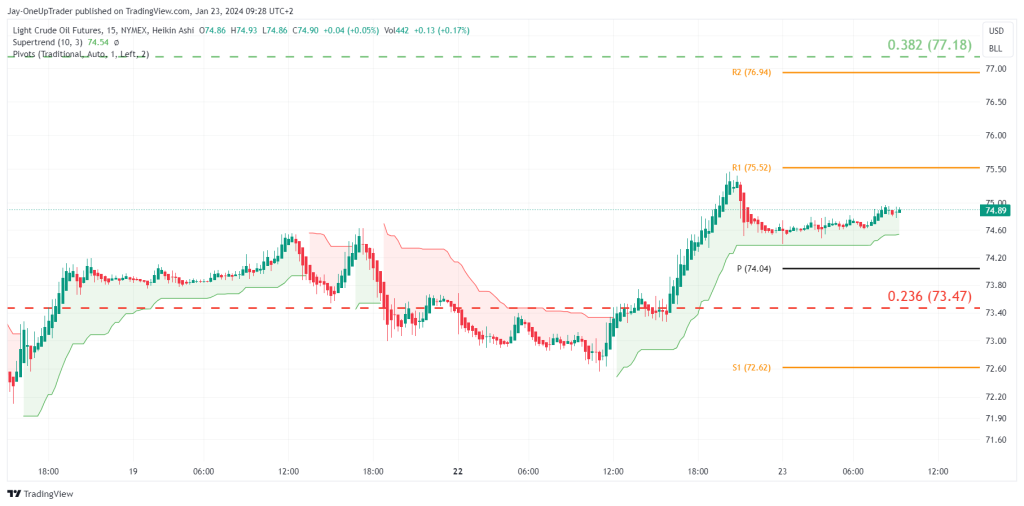
15-Minute Chart Analysis:
On the 15-minute Heikin Ashi chart, we see a more granular view of the price action. The Heikin Ashi candles show a green trend with a steady climb, and the price is currently hovering just above the pivot point (P) at $74.04. The next resistance levels for us to watch are R1 at $75.52 and R2 at $76.94. A break above these could validate the short-term bullish bias. The Supertrend indicator is currently green, further supporting the bullish outlook in the short term.
Key Levels to Watch:
- Support: The key support level for us on the weekly chart is at $74.00. If this level holds, we could see the bullish trend continue.
- Resistance: On the daily chart, the immediate resistance level for us is at $77.18 (0.382 Fibonacci level), followed by $80.32 (0.5 Fibonacci level).
Potential Trades:
- Bullish Trade: We can consider a long position if the price holds above the $74.00 support level, with a stop loss below this level to manage risk. Our target could be set at the next resistance level of $77.18, with a further target of $80.32 if bullish momentum continues.
- Bearish Scenario: Should we see a reversal and a break below $74.00, a short position could be taken with a stop loss just above this level, targeting the lower end of the consolidation zone.
Rating:
Based on the analysis of the charts, the rating is Bullish. The weekly and daily charts show a breakout from consolidation and channel patterns, and the moving averages are trending upwards, which are strong bullish signals. The 15-minute chart confirms this bullish bias with a green Supertrend and Heikin Ashi candles. However, we need to be watchful of the price holding above the key support level of $74.88 to maintain this bullish outlook.