Weekly Chart Analysis for NASDAQ 100 E-mini Futures:
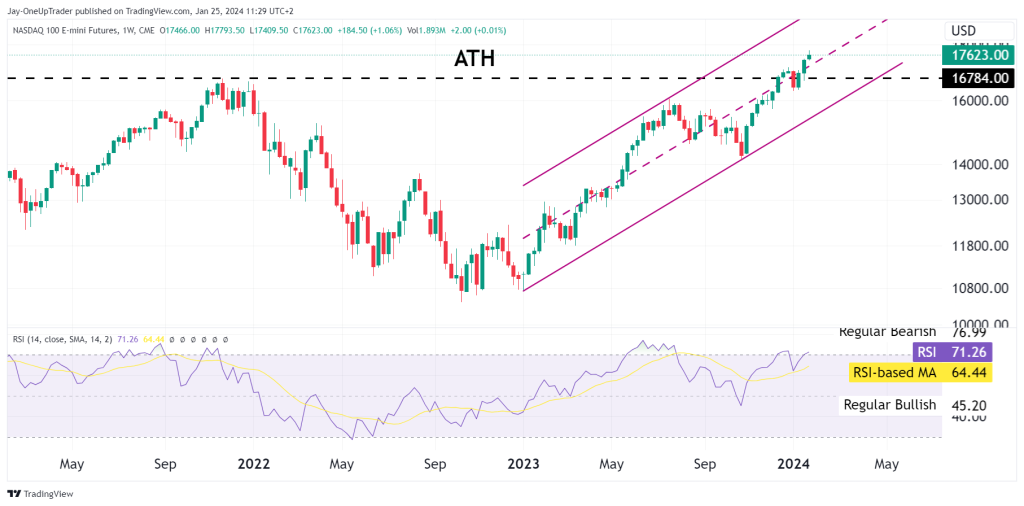
The weekly chart shows price in a clear ascending channel pattern, with NQ positioned in the upper half of the channel. The Relative Strength Index (RSI) is sitting in overbought territory, however. The all-time high (ATH) stands as the ultimate resistance level, which price has closed above in two straight weeks. A new close above it this week looks extremely likely to cement the bullish sentiment.
Daily Chart Analysis:
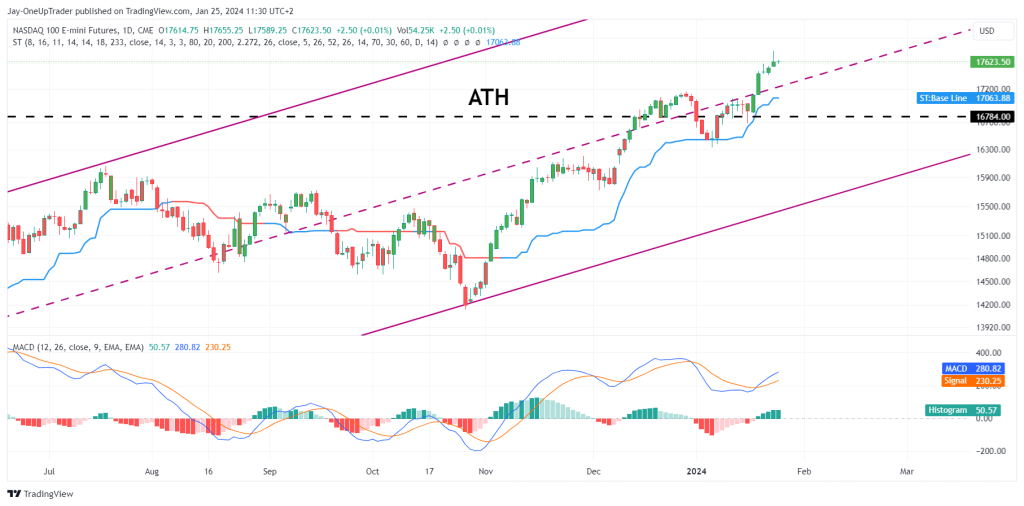
The daily chart showcases the price action above both the SuperTrend indicator’s buy signal and the rising channel support, reinforcing the bullish outlook. The Moving Average Convergence Divergence (MACD) is above the signal line and in positive territory, supporting the continuation of the uptrend. The immediate level to watch is the ATH as a pullback may come our way, and then it will come down to whether the old ATH will hold as support.
15-Minute Chart Analysis:
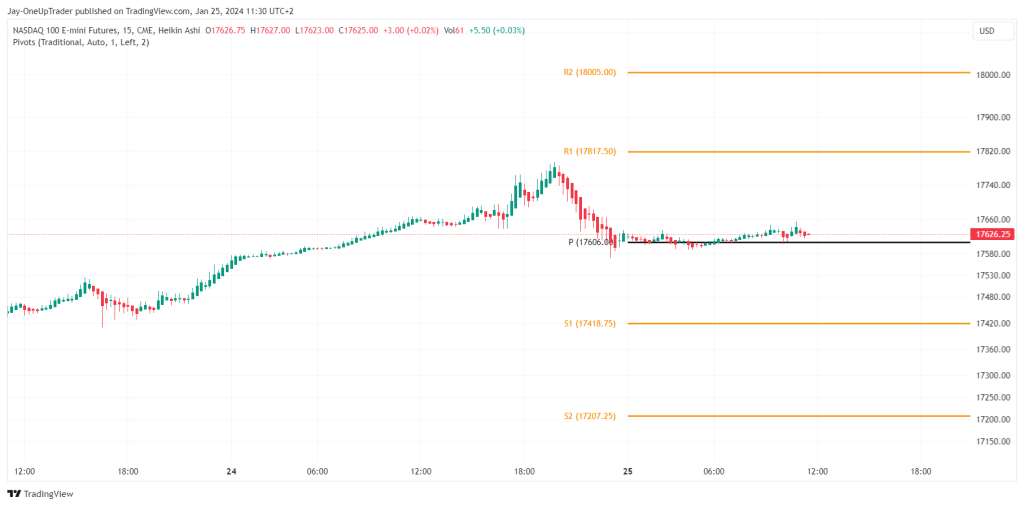
On the 15-minute Heikin Ashi chart, the pivot points indicate immediate support at the pivot point (P) around $17,606, with resistance levels (R1 and R2) at approximately $17,817.50 and $18,005.00. The chart suggests a consolidation phase, and a breakout above R1 could signify a short-term bullish continuation toward the R1 level.
Levels to Watch:
- Long-Term Resistance (ATH): Near $17,790.00
- Short-Term Resistance (R1): $17,817.50, followed by (R2) $18,005.00
- Immediate Support (Pivot Point): $17,606.00
- Further Support (S1): $17,418.75 and (S2) $17,207.25
Trades to Take:
- A conservative approach would be to enter a long position upon a daily close above the channel’s upper boundary, targeting the new ATH, with a stop loss just below the channel support.
- A more aggressive strategy would be to enter a long position if the price breaks above the R1 pivot point ($17,817.50) on the 15-minute chart, with a stop loss below the pivot point ($17,606.00), aiming for R2 ($18,005.00) as the target.
Rating:
The rating is Bullish based on the current charts. The ascending channel on the weekly chart and the price above the SuperTrend indicator on the daily chart, along with a positive MACD, all suggest strong bullish momentum. However, it’s important for us to consider that the RSI is approaching overbought levels, which could indicate a potential pullback or consolidation in the near term.
As always, you should manage your risk carefully, set appropriate stop losses, and adjust your positions according to the changing market conditions.