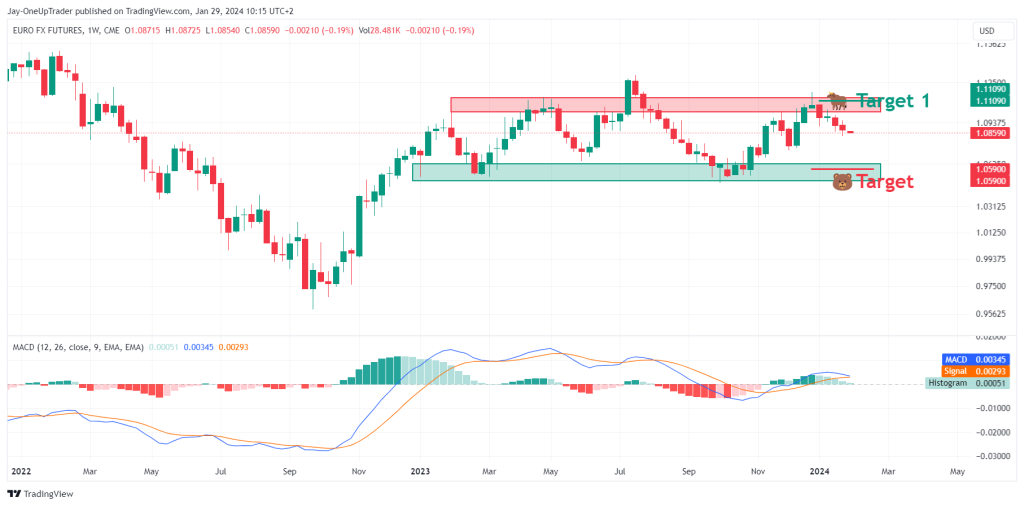
Weekly Chart Analysis for EURO FX Futures:
The weekly chart shows price oscillating between a tight range of support and resistance. The Moving Average Convergence Divergence (MACD) is flat and close to the zero line, indicating a lack of strong momentum in either direction. The support zone around 1.05900 is critical, and a break below would indicate the bears are taking control, while resistance at 1.11090 is the level bulls need to breach for a positive outlook.
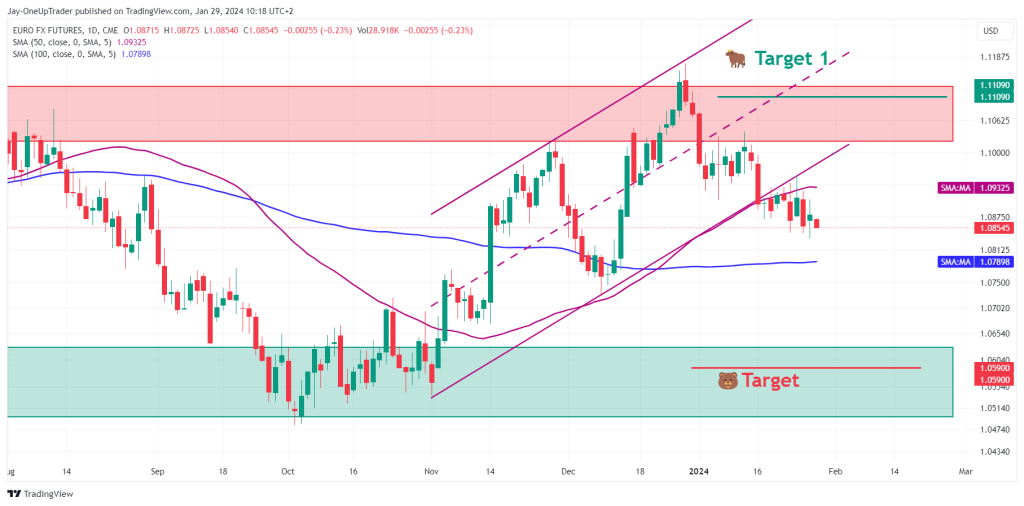
Daily Chart Analysis:
Price action on the daily chart is in between the 50-day Simple Moving Average (SMA) and the 100-day SMA, suggesting indecision in the market. Bears are targeting the lower support zone and bulls are targeting the upper resistance zone. At the moment, bears seem to have the upper hand slightly.
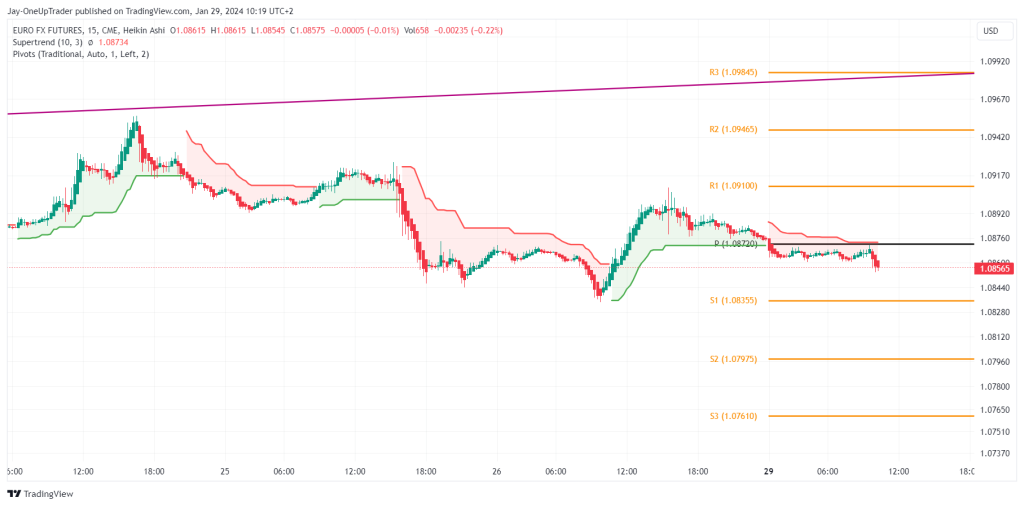
15-Minute Chart Analysis:
The 15-minute Heikin Ashi chart, combined with SuperTrend and traditional pivot points, indicates immediate resistance at R1 (1.09100) and support at the pivot point (P) around 1.08720. The price is currently below the SuperTrend line giving us a short term bearish outlook too.
Levels to Watch:
- Weekly Resistance: 1.11090
- Weekly Support: 1.05900
- Short-Term Resistance (R1): 1.09100
- Immediate Pivot Point (P): 1.08720
- Short-Term Support (S1): 1.08355
Trades to Take:
- If the price respects the weekly support at 1.05900, a long position could be considered with a stop loss below this level, targeting the resistance at 1.11090.
- Intraday traders could use the 15-minute chart’s pivot points for shorter-term trades, going long if the price moves above the pivot point with a stop loss below S1, or short below the pivot point with a stop above R1.
Rating:
The overall rating is Neutral to Bearish. The lack of momentum indicated by the MACD on the weekly chart and the price trading below the 50 SMA on the daily chart suggests caution. The descending channel on the daily chart needs to be monitored closely, as a break below its lower boundary could shift the bias to strongly bearish, while a break above could offer a short-term bullish opportunity.