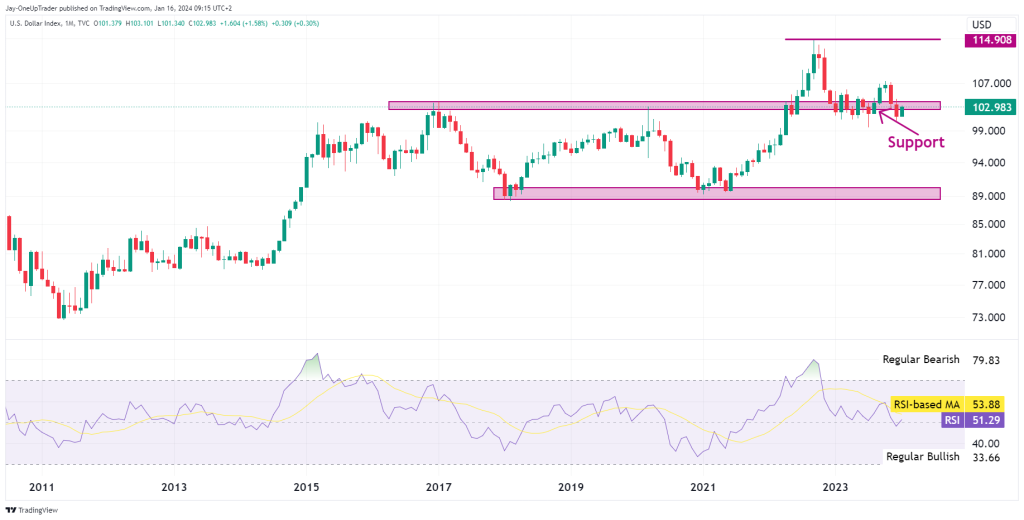
Weekly Chart
We observe a clear support zone around the 102.00 level, which price is currently testing. If we see a strong bullish response at this zone, we could anticipate a rally towards the upper resistance near 114.90. However, a break below this support could lead us to look for further downside targets near the next significant support region, around 94.00. The RSI is hovering near the midpoint, suggesting a lack of strong momentum, which aligns with the indecision at current price levels.
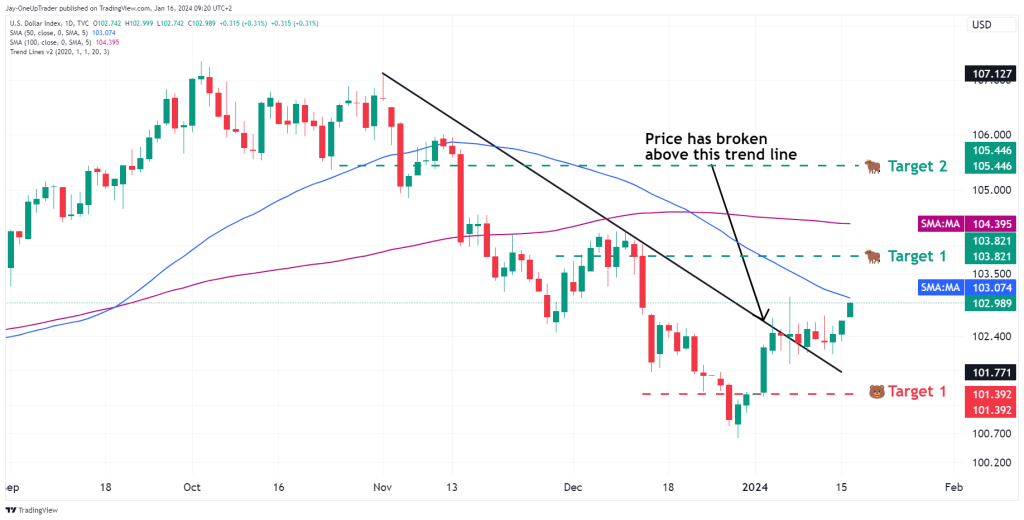
Daily Chart
The price has broken above a descending trend line, indicating a shift from bearish to bullish sentiment in the mid-term. Targets are set at 105.446 (Bull Target 2) and 103.821 (Bull Target 1). A sustained move above these levels could reinforce bullish momentum. Conversely, if the price fails to rally from here, we may revisit lower support at 101,392. Price is also nearly testing the 50 SMA which may be a small hurdle for bulls in the short term.
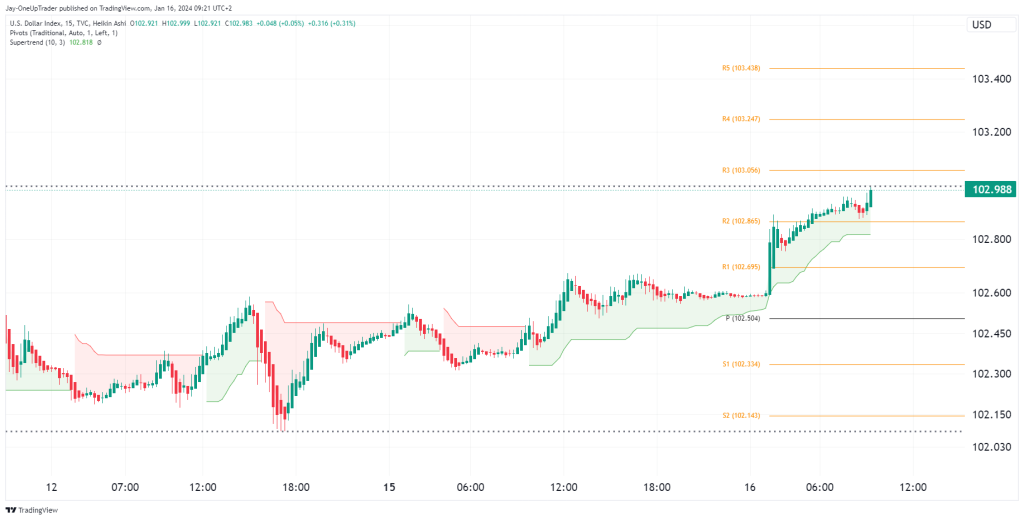
15 Minute Chart
We’re looking at a Heikin Ashi chart in the short term, which smoothens price action. The price is currently above the R2 pivot point at 102.865, with the SuperTrend indicator suggesting a bullish stance in this time frame. If the price sustains above the R2, we could aim for the R3 pivot at 103.056, while a break below the SuperTrend line might invalidate the short-term bullish view.
Trades
- If the long-term support holds, a long position with a target of 114.90 could be considered, with a stop-loss order placed just below the support zone +/- $99.
- For mid-term trades, entering long positions on retests of the broken trend line with targets at 105.446 and 103.821 could be viable.
- In the short term, trading within the pivot levels, buying near the SuperTrend line with a target at R3, and selling below the SuperTrend line with a stop above R2 could be effective strategies.
The confluence of the mid-term trend line break and the SuperTrend indicator’s bullish signal in the short term suggests a higher probability of upward price action. However, the neutral RSI in the long term warns us to remain cautious, as there could be a potential reversal if the 102.00 support does not hold.
Ratings:
- Long-Term: Neutral-Bullish. The support at 102.00 is key; a sustained hold or bounce could tip us into a bullish breakout, but a lower break would shift the bias to bearish.
- Mid-Term: Bullish. The break above the descending trend line suggests increasing bullish momentum, targeting 105.446 and 103.821.
- Short-Term: Bullish. The Heikin Ashi chart shows a strong bullish trend, and staying above the SuperTrend line and R2 pivot point would likely continue to support this bias.
Overall Rating: Cautiously Bullish. The analysis across different time frames indicates a bullish tilt. We should watch the 102.00 support level closely, as it’s pivotal for the bullish scenario to unfold. If you decide to take a trade, remember to manage risk appropriately and set stop losses, considering the market can always move against your position. This article is in no way a recommendation to buy or sell.