Weekly Chart Analysis:
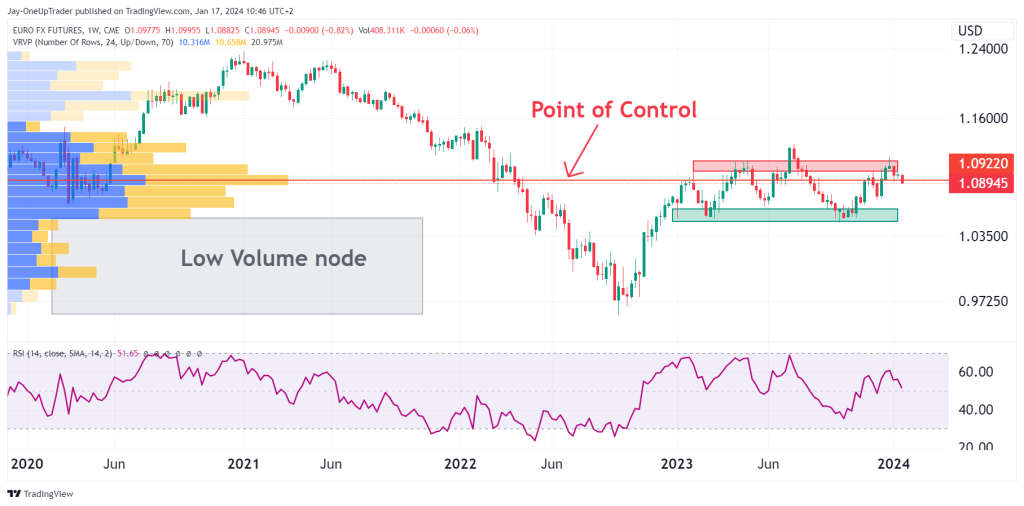
The weekly chart exhibits a consolidation pattern with a clear ‘Point of Control’ at approximately 1.09220. This level represents the price with the highest volume traded over the analyzed period and acts as a significant area of balance between supply and demand. The presence of a ‘Low Volume Node’ below this range suggests a lack of interest at lower prices, which could indicate underlying strength. If the bulls can maintain price action above this ‘Point of Control’, we could see an attempt to push higher toward the 1.11600 resistance zone. However, a break below the low volume node near 1.03500 could trigger a sharp decline due to the lack of historical support in the long term.
Daily Chart Analysis:
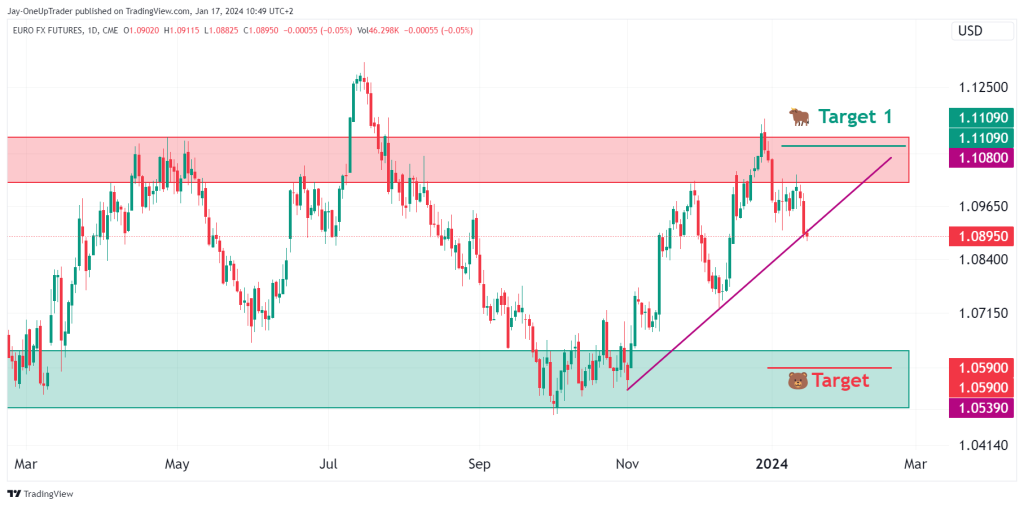
The daily chart shows a rising trendline support, with price having recently tested a resistance block between 1.10800 and 1.111090. If bulls can hold the support line, it could lead us to set our sights on ‘Target 1’ at 1.111090 as a potential profit-taking zone. Conversely, should we witness a rejection at this level, the attention shifts to the downside ‘Target’ around 1.05900, which aligns with the rising trendline and a historical support zone.
15-Minute Chart Analysis:
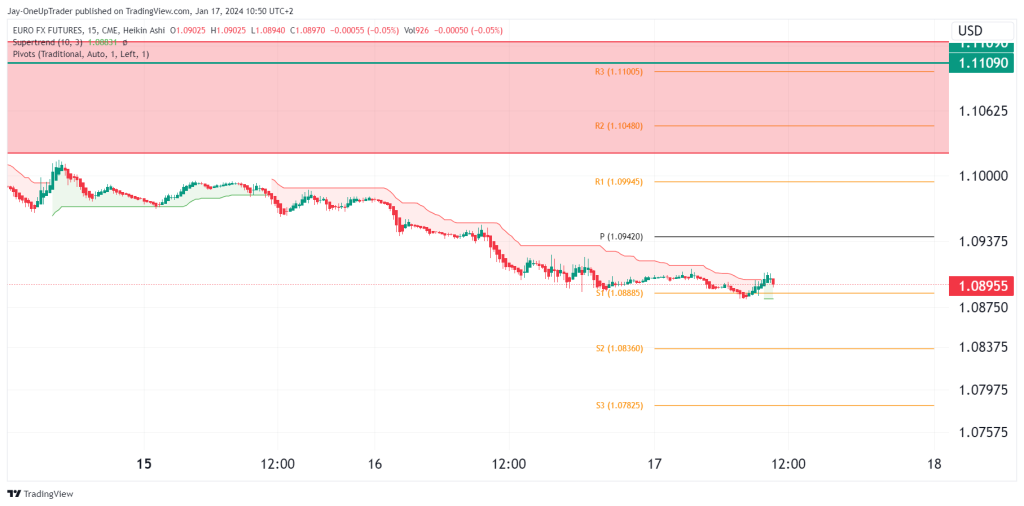
On the 15-minute chart, the Heikin Ashi candles indicate a consolidation phase. The Supertrend indicator suggests a neutral to bearish sentiment as the price fluctuates below the pivot level (P) at 1.09420. Immediate support and resistance levels are identified by the pivot points S1 (1.08885) and R1 (1.09945), respectively. A breach above R1 could signal short-term bullish momentum, while a drop below S1 may accelerate selling pressure towards S2 (1.08360) and S3 (1.07825).
Trade Scenarios:
- Bullish Scenario: A sustained move above the ‘Point of Control’ on the weekly chart, coupled with the trend line on the daily chart holding, could validate a long trade, targeting 1.11600 for the long term on the weekly and 1.111090 on the daily chart.
- Bearish Scenario: Failure to breach the resistance block on the daily chart could open up a short trade, with an initial target at the daily trendline support and then the support at 1.05900.
Rating:
The overall rating leans towards a cautiously bullish bias, primarily due to the price holding above the ‘Point of Control’ on the weekly chart and the ascending trendline support on the daily chart. The potential for a bullish breakout is there, but it is contingent on the price action we witness at the key resistance levels. A clear directional move will be confirmed either by a strong breakout above daily resistance or a decisive close below the weekly ‘Point of Control’. Keep a close watch on these levels, as they will be crucial in determining the short to medium-term trend direction.
The information in this article is in no way a recommendation to buy or sell.