

Introduction
Crude oil futures continue to weaken following our previous analysis, with sellers pushing below the important support level at $74.
This was a very important zone to stay above for the bullish case to remain intact, as the market is now starting to turn bearish rather than consolidating within a longer-term uptrend.
The market has now erased nearly the entire geopolitical risk premium that fueled the rally during March and April. Our attention now shifts to whether buyers can defend the 200-day moving average or if this correction has further to run.
Let’s take a closer look at the technicals.
CL Futures Trend Analysis
Important Points
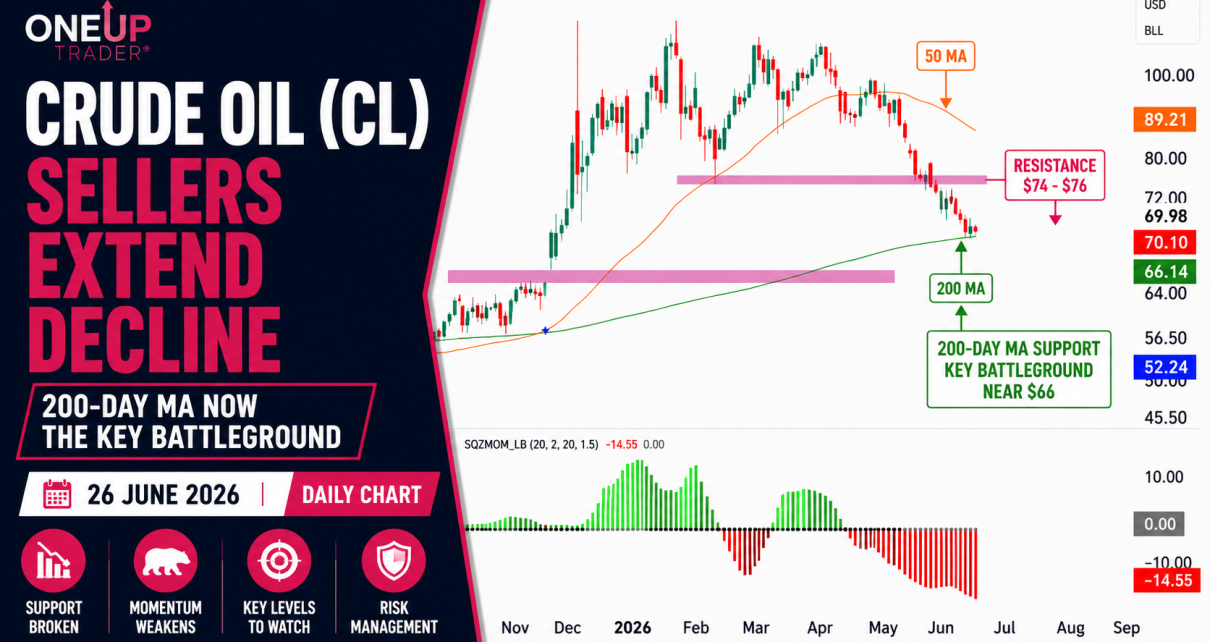
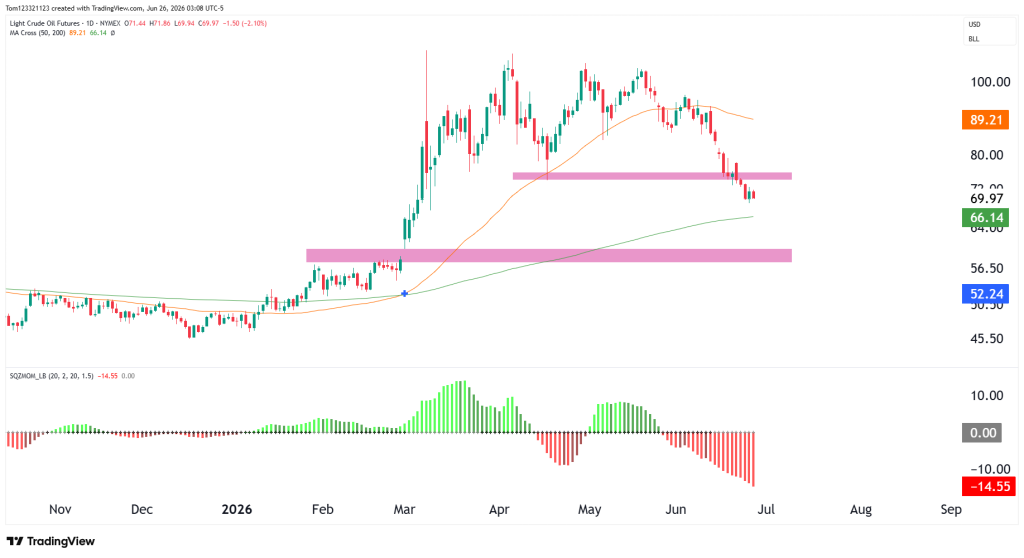
Current technicals show:
- Current price trading around $70.10
- 50-day moving average near $89.21
- 200-day moving average near $66.14
- Former support near $74-$76 now acting as resistance
- Major long-term support near the 200-day moving average
The 200-day MA is a very important level to hold for the bulls, because if we see the price drop below that, the market is likely going to want to close the gap that formed at $58,58 back on the 17th of April.
The CL market is now starting to look bearish and is no longer in a consolidation period within a longer-term uptrend. In order for that to be the case once more, we need to see bulls move the market back above $74. For this to happen, a geopolitical development would be required.
Estimated Probabilities for CL Futures
| Scenario | Estimated Probability | Market Interpretation |
|---|---|---|
| Consolidation near the 200-day moving average | 45% | Buyers attempt to stabilize price around long-term support |
| Breakdown below the 200-day moving average toward $60 | 35% | Selling pressure continues and the correction deepens |
| Recovery back above $75 resistance | 20% | Buyers reclaim former support and improve the short-term outlook |
Key Support and Resistance Levels
Major Resistance Levels
- $74-$76 former support
- $80
- $89.21 (50-day moving average)
Major Support Levels
- $66.14 (200-day moving average)
- $60 psychological support
- $52 previous breakout zone
CL Possible Trades
Support Reaction Trade
The 200-day moving average is now the most important level on the chart. If buyers begin defending this area with strong reversal candles and improving momentum, crude oil could enter a recovery phase after the recent correction.
Consolidation Trade Setup
Following several weeks of steady selling, it would not be surprising to see price move sideways around the 200-day moving average. Markets often pause at major technical levels while buyers and sellers establish a new equilibrium.
Bearish Continuation Trade
The short-term trend remains bearish while price trades below both the former support zone and the 50-day moving average. If the 200-day moving average fails to hold, the correction could accelerate toward the $60 region as longer-term buyers step aside.

This analysis is provided for educational and informational purposes only and should not be considered financial or trading advice. Trading futures, forex, and other leveraged financial instruments carries a high level of risk and may not be suitable for all investors. Past performance is not indicative of future results. Before making any trading decisions, conduct your own research, assess your risk tolerance, and consult with a qualified financial advisor if necessary.

