

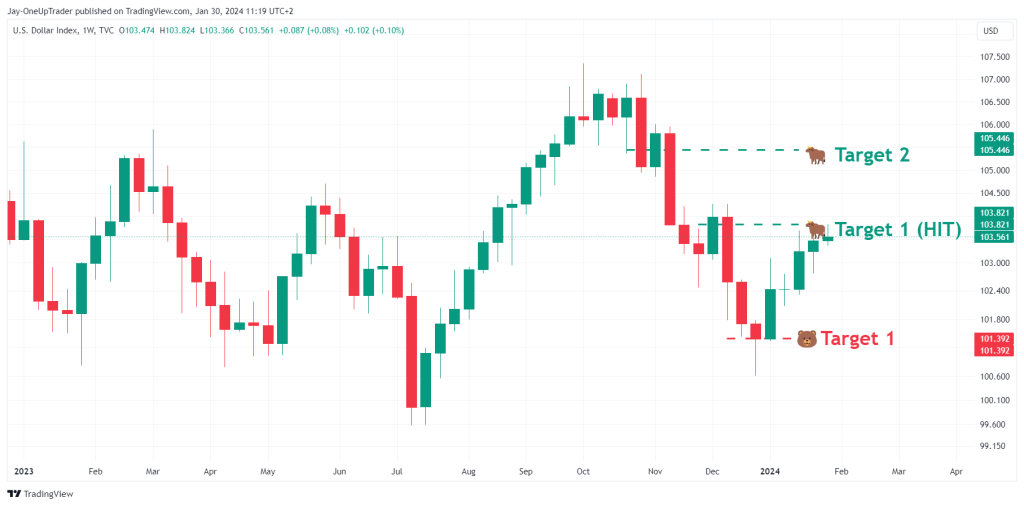
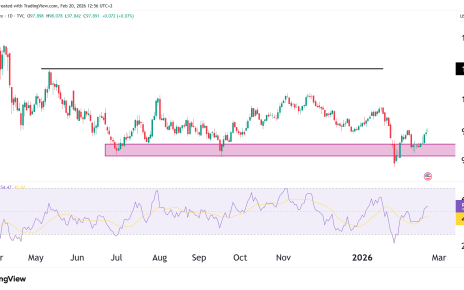
Weekly Chart
Starting with the weekly chart, the Dollar has shown significant strength. Bulls have clearly taken control as indicated by the 4 weekly green closes in a row. We have successfully reached our first bullish target at 103.821, from our analysis last week. The current movement suggests that we could see further upside momentum, with the next level for the bulls to conquer being Target 2 at 105.446.
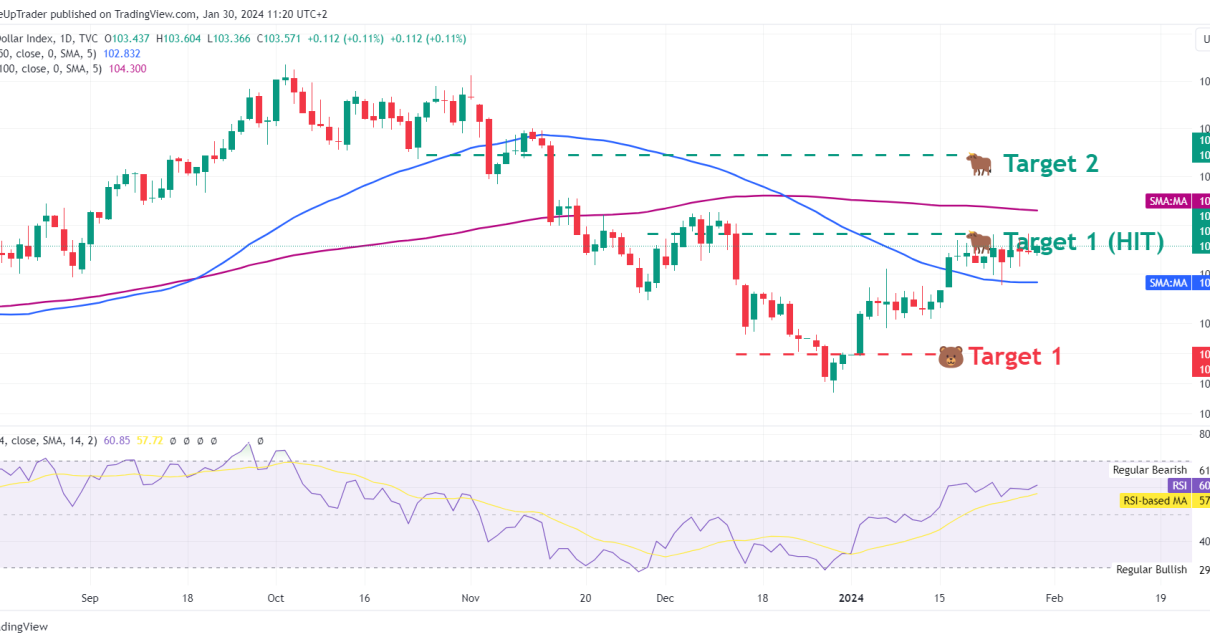
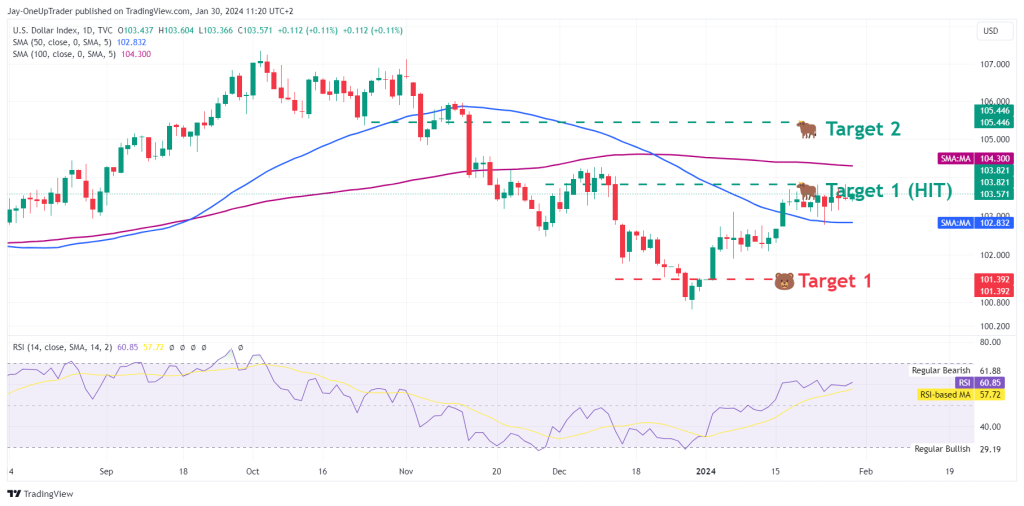
Daily Chart
On the daily chart, the DXY is trading above the 50-day MA and just below the 100-day MA. The 50 SMA is acting as a dynamic support level. The index has already hit our first bullish target (Target 1 HIT) at 103.821, and the momentum indicated by the RSI, currently above the midline but below overbought territory, suggests that there’s room for growth towards Target 2 at 105.446.
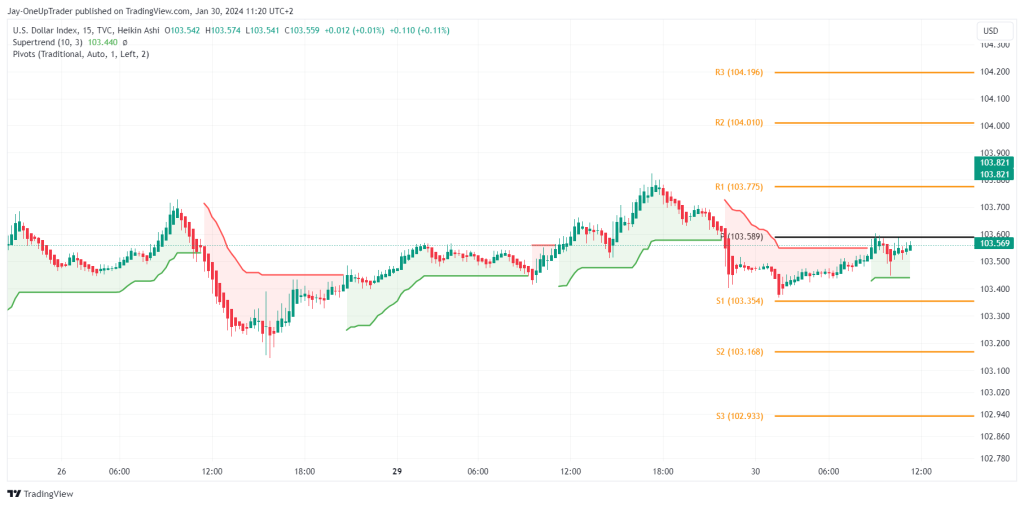
15 Min Chart
The 15-minute chart shows the DXY interacting with the pivot points. The Heikin Ashi chart indicates a mixture of bullish and bearish momentum in intraday trading. However, the Supertrend indicator is green, suggesting an overall bullish trend on this timeframe. The index is currently testing resistance near the R1 pivot point at 103.775. A sustained break above this level could see us aiming for R2 at 104.010 and R3 at 104.196.
Key Levels to Watch:
- Support: The 103.354 level, marked as S1 on the 15-minute chart, is critical. If this holds, it will reinforce the bullish scenario. If the bulls are indeed strong enough, we do not expect this level to break.
- Resistance: On the upside, the immediate level to watch is 103.775 (R1 pivot point). Beyond this, the 104.010 (R2) and 104.196 (R3) are the subsequent targets for bulls.
Potential Trades:
- Bullish Scenario: A long position could be initiated above the R1 pivot point with a stop-loss just below it. Take profits could be partially booked at R2 and fully at R3, depending on the strength of the momentum.
- Bearish Scenario: Should the Dollar break below S1, a short position could be considered with a stop-loss set above the S1 level to limit risk, targeting the S2 at 103.168 and S3 at 102.933.
Given the current chart patterns and momentum indicators, our rating is bullish. The DXY has sustained above-significant moving averages on the daily chart and is poised to test further resistance levels. The weekly close above previous consolidation zones bolsters this bullish outlook.
You can read about our previous analysis where Target 1 was predicted, which has now been met, indicating that bulls are now setting their sights on Target 2. To stay updated and informed, follow the progression of these targets on our analysis page here.
