

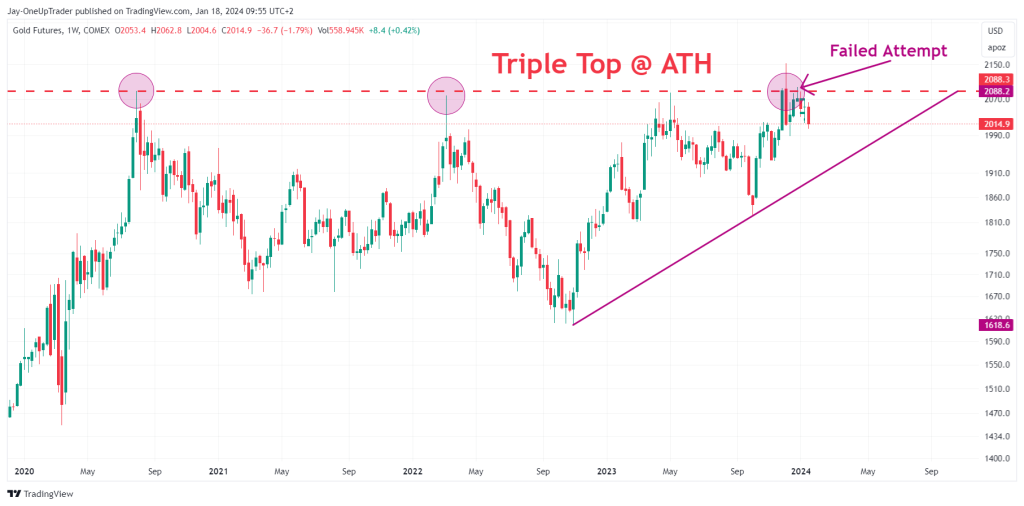
Weekly Chart
The weekly chart shows how significant the false break has been in GC with bulls still unable to push through. The recent ‘Failed Attempt’ to break above this level is beginning to show signs of exhaustion from the bulls. Immediate support is seen at the rising trendline, currently near the 1974.4 mark. A decisive break below this trendline could accelerate selling pressure towards the next key support level at 1618.6.
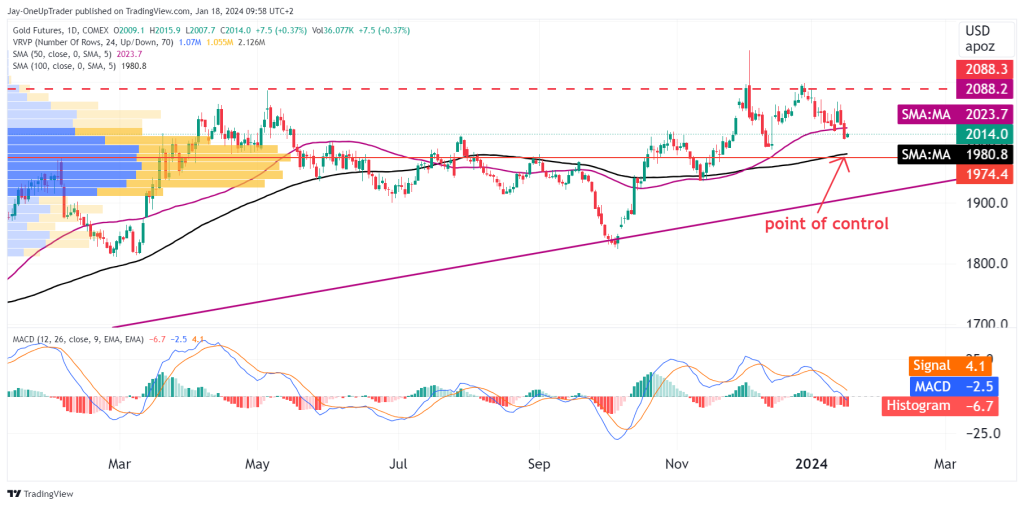
Daily Chart
On the daily chart, the price was oscillating around the Point of Control for over a year, indicating a fair value area around 1974.4 where the most trading activity has occurred. The moving averages (SMA 50 and SMA 100) are converging near this zone, which could act as a dynamic support level as price sits inside the band. This is where bulls could accumulate. The MACD is currently negative, signaling bearish momentum in the short term. However, as long as the price remains above the ‘Point of Control’ and the moving averages, the medium-term outlook could remain neutral to slightly bullish.
15-Minute Chart
The 15-minute chart shows a short-term downtrend as indicated by the Heikin Ashi candles trending below the Supertrend line. The immediate resistance level is at the pivot R1 (2039.6), with further resistance at R2 (2059.4). Support is found at S1 (2002.2). A break above R1 could indicate a shift in short-term sentiment, potentially targeting R2. Conversely, a move below S1 could see further downside towards the 2000.0 psychological level.

Trade Scenarios:
- Bearish Trade: Given the failure at the triple top formation on the weekly chart, if we see a break below the trendline support at 1974.4, a short position could be initiated with a potential target at 1618.6, respecting the significant resistance established at ATH.
- Bullish Trade: For a bullish scenario, we would need to see price remain above the daily ‘Point of Control’ and the moving averages. A successful breach above the daily resistance at 2088.2 could invalidate the triple top pattern, potentially setting up a long trade targeting new highs above the ATH.
Rating:
The overall analysis skews towards a bearish outlook, mainly due to the triple top pattern on the weekly chart and the failed attempt to break above the ATH. The bearish MACD on the daily chart adds to this perspective. However, the price’s proximity to the ‘Point of Control’ and the moving averages provides a neutral to bullish stance. A clear directional bias would require a breakout above the ATH for a bullish scenario or a break below the trendline support on the weekly chart for a confirmed bearish stance.
The technical analysis in this article is in no way a recommendation to buy or sell.