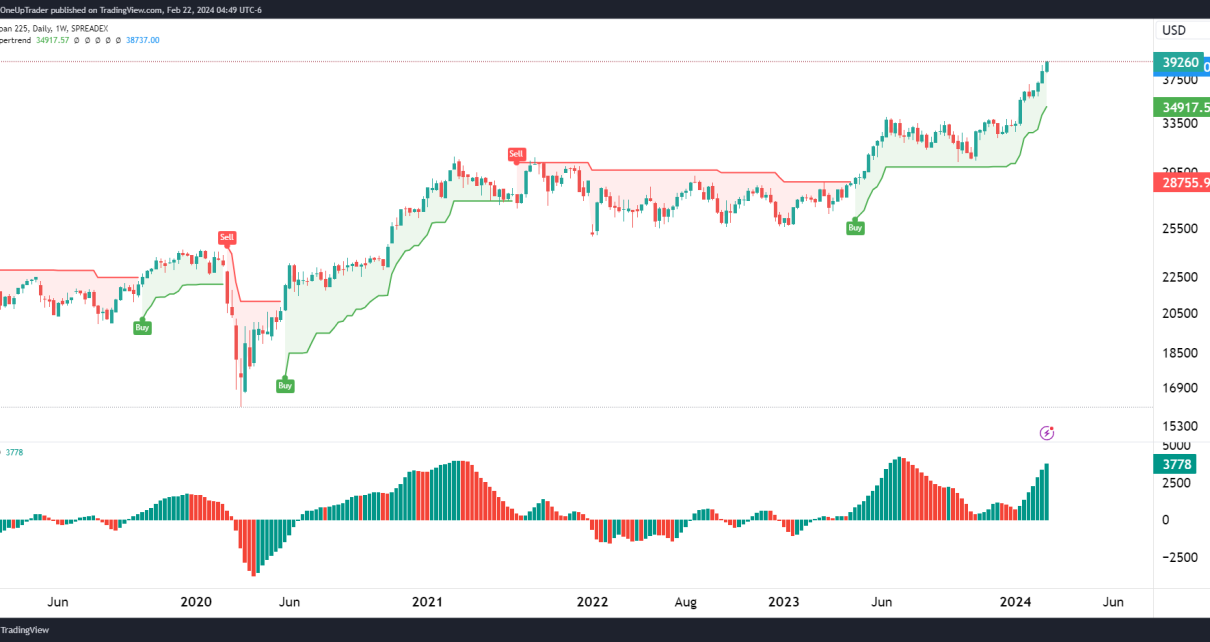
Weekly Chart Key Levels to Watch on the Weekly: Daily Chart Key Levels to Watch on the Daily: Potential Trades: It’s essential to monitor these levels and adjust strategies accordingly. The rising wedge and RSI divergence should be watched closely for signs of a potential reversal. Remember to manage risks effectively, as markets can always Read More…
Technical Analysis
Dollar falling again? Technical outlook
Weekly Chart The U.S. Dollar shows a symmetrical triangle pattern, which is typically indicative of a continuation or a reversal pattern depending on the breakout direction. Price is sitting at the top end of the triangle and is also in a multi-year support/resistance zone. Key Levels to Watch on the Weekly: Daily Chart On the Read More…
Light Crude Oil Futures: Technical Outlook
Weekly Chart AnalysisThe Light Crude Oil Futures on the weekly chart have a clear consolidation pattern within a defined support zone. Volume Profile Visible Range (VPVR) indicates substantial trading activity at these levels. The Relative Vigor Index (RVI) is setting a steady momentum, with the RVI line slightly above its moving average, indicating a slight Read More…
Nikkei 225 surges; technical outlook
Weekly The weekly chart of the Nikkei Futures has been in a strong uptrend, as indicated by the SuperTrend indicator, which has been green for an extended period. The Awesome Oscillator (AO) is positive too as the Japanese index surges to new highs. Key Levels to Watch on the Weekly: Daily On the daily chart, Read More…
Bitcoin Surges above $52,000; Upside Expected
Weekly Chart The weekly time frame shows that price is approaching the previous all-time high, a big milestone for Bitty. The swing high extensions (Swing:SH Ext at 32165) serve as a reference point for potential resistance on further moves up. This swing indicator will likely print a higher low soon around $40,000. Key Levels to Read More…
Dow Jones Futures (YM) Spinning Top Candlesticks
Weekly Chart The weekly chart has formed spinning tops near the recent all-time high. This tells us that there is indecision in the market. The RSI is currently overbought at 71.31. before the formation of the spinning tops there was only 1 red week out of 14. This amount of bullish price action cannot last Read More…


