Weekly Chart
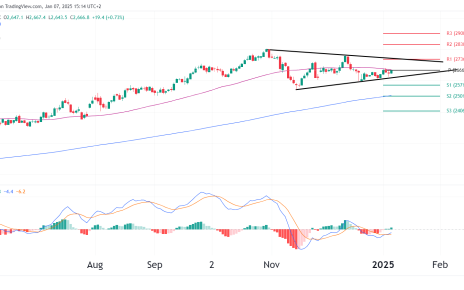
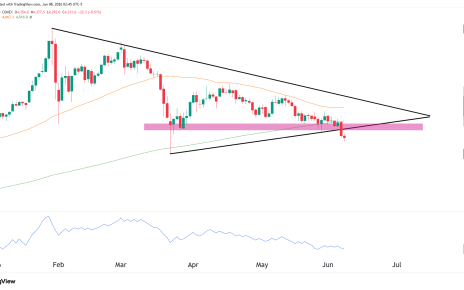
The U.S. Dollar shows a symmetrical triangle pattern, which is typically indicative of a continuation or a reversal pattern depending on the breakout direction. Price is sitting at the top end of the triangle and is also in a multi-year support/resistance zone.
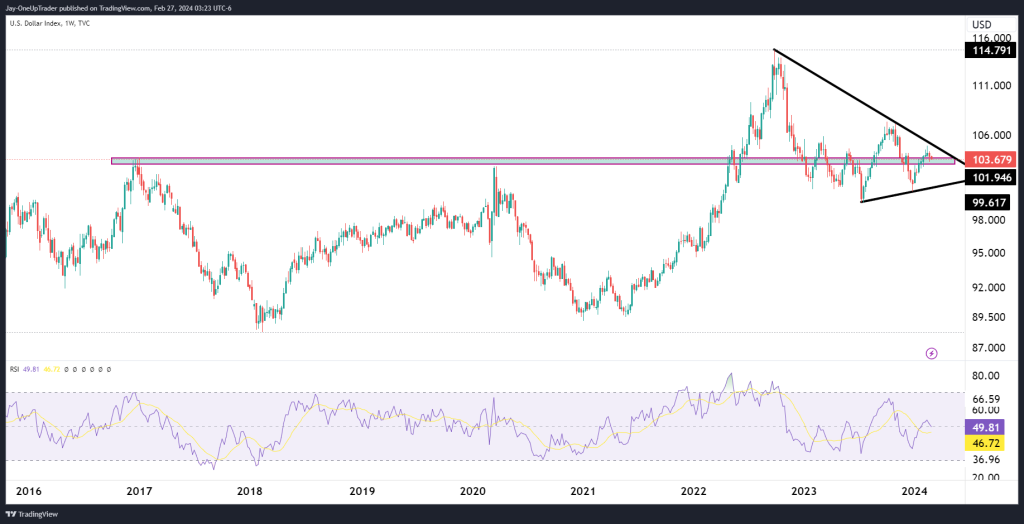
Key Levels to Watch on the Weekly:
- Support: The lower trendline of the triangle near 101.946 is the critical support. A decisive break below could indicate bearish momentum, leading to further declines.
- Resistance: The upper trendline, currently intersecting near 103.679, is the immediate resistance. A breakout above this level may propel the index towards the horizontal resistance at 114.791.
Daily Chart
On the daily timeframe, the DXY is trading slightly above the 50-day SMA at 103.172, which aligns with the lower boundary of the triangle pattern seen in the weekly chart. The 200-day SMA is currently positioned below the price, but the MA is flat showing us there is no real trend on the daily.
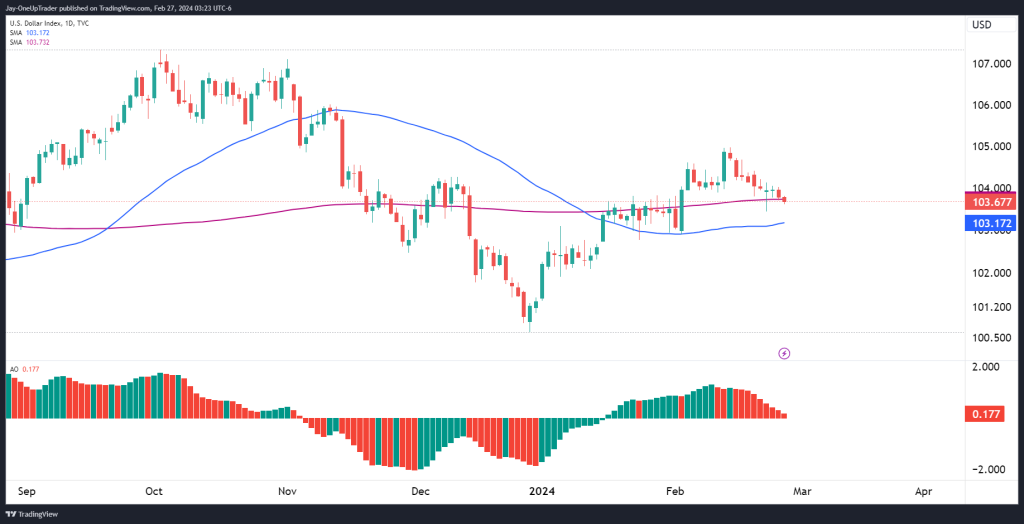
Key Levels to Watch on the Daily:
- Support: The 50-day SMA at 103.172 is serving as short-term support.
- Resistance: A short-term resistance level is formed by the triangle’s upper trendline, which needs to be broken for the bullish scenario to continue.
Technical Indicators:
- The RSI on the weekly chart is neutral, indicating room for movement in either direction without being in the overbought or oversold territory.
- The AO indicator on the daily chart is showing a slight positive momentum, which may support a bullish breakout from the triangle pattern.
Potential Trades:
- Bullish Scenario: If we see a breakout above the triangle’s upper trendline, consider a long entry with a target at the horizontal resistance of 114.791. A stop loss can be placed just below the breakout level to mitigate risk.
- Bearish Scenario: A break below the triangle’s lower trendline could be an opportunity to go short, targeting the next significant support level. The stop loss in this case would be just above the trendline to minimize potential losses.
As traders, we need to monitor the price action closely as it approaches the triangle’s apex. The breakout direction will likely determine the DXY’s course over the following weeks or months. Ensure that risk management strategies are in place, considering the volatile nature of index movements.