

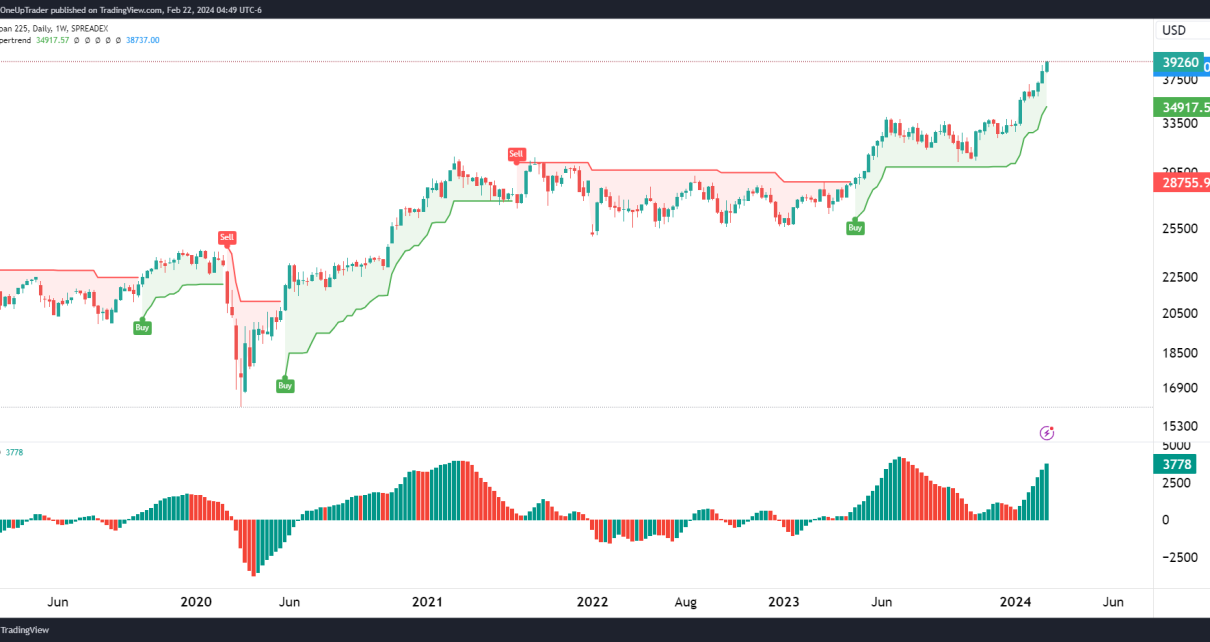
Weekly
The weekly chart of the Nikkei Futures has been in a strong uptrend, as indicated by the SuperTrend indicator, which has been green for an extended period. The Awesome Oscillator (AO) is positive too as the Japanese index surges to new highs.
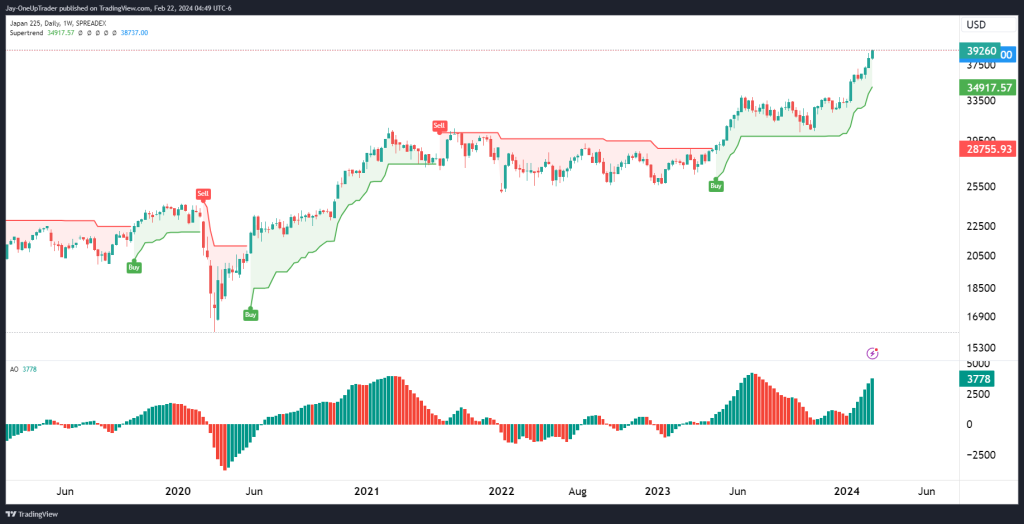
Key Levels to Watch on the Weekly:
- Support: The SuperTrend line at 34917.57 acts as dynamic support. As long as the price remains above this level, the long-term bullish trend is considered intact.
- Resistance: The recent high at around 39260 is the immediate resistance. A weekly close above this level could signal continued bullish strength.
Daily
On the daily chart, the price is trading well above the 50-day SMA at 35493 and the 200-day SMA at 33926, confirming the strength of the current uptrend. The RSI is in the overbought territory, which could indicate a short-term pullback or consolidation could be imminent, and there is a slight hint of bearish divergence.
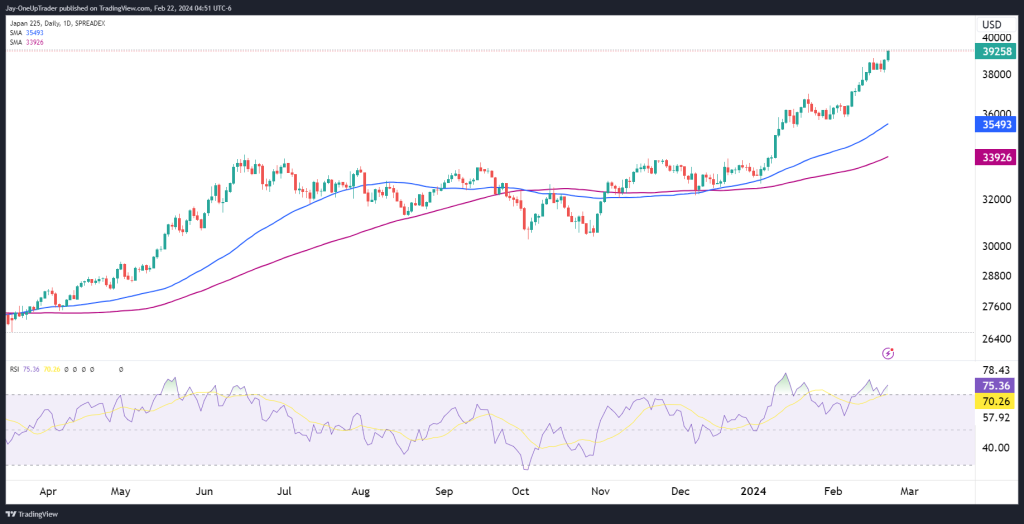
Key Levels to Watch on the Daily:
- Support: The 50-day SMA at 35493 serves as the nearest significant support level.
- Resistance: The recent top at 39260 will be the resistance to watch for potential breakout trades.
15-Minute
The 15-minute Heikin Ashi chart shows a consolidation with the price hovering around the pivot point (P) at 38780. Heikin Ashi candles indicate a slight pause in the trend, which is typical after a strong directional move.
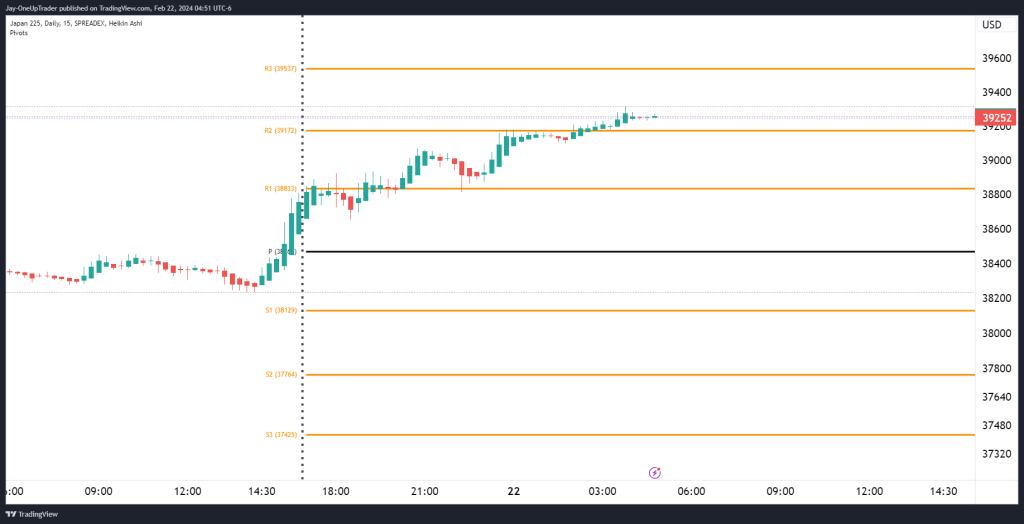
Key Levels to Watch on the 15-Minute:
- Pivot Point (P): The level at 38780 will be pivotal. Holding above this could suggest that short-term bulls are looking to push prices higher.
Potential Trades:
- Bullish Trade: If the price action holds above the pivot point, a long position could be considered on a pullback from here. The target would be the daily high at 39260, with a stop loss placed below the pivot point or the 50-day SMA, depending on risk tolerance.
- Bearish Trade: Should the price break below the pivot point, a short position could be initiated with the target set at the 50-day SMA at 35493. A stop loss could be placed above the pivot point to minimize potential losses if the downtrend does not materialize.