In an impressive display of bullish momentum, the S&P 500 E-mini Futures have charted a path toward new heights. As we analyze the current trend, it’s clear that the bulls have taken the reins, with the recent close above the critical support level of $4244.75 signaling confidence in the US economy.
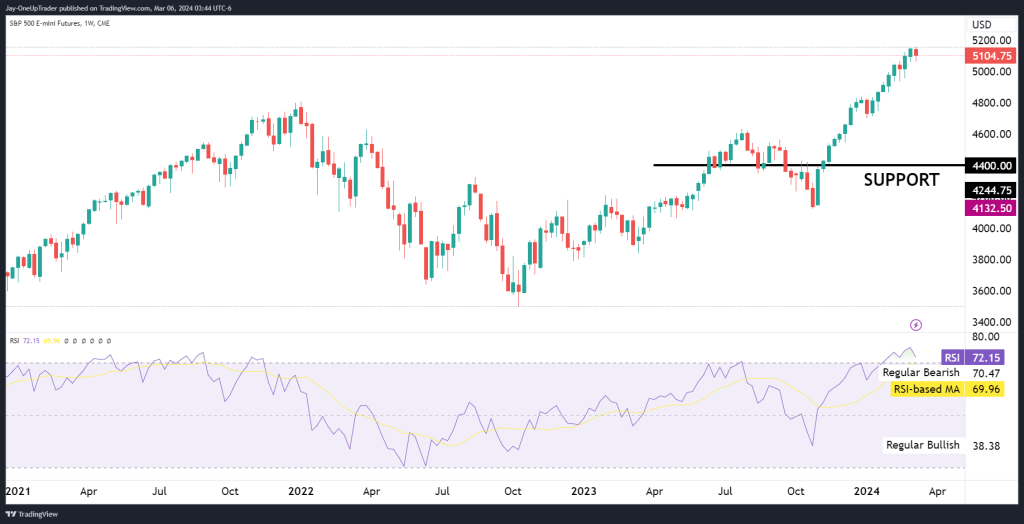
The key takeaway from the S&P 500 weekly chart is the solidification of support around the $4244.75 mark. This area, previously a battleground for buyers and sellers, has now become a launchpad for a potential further rally. The price has consistently found buyers at this level, forming a strong base.
As we turn our gaze upwards, the all-time high of $5104.25 comes into focus on ES. We could see this price level break if the bulls continue to push with the same tenacity observed in recent weeks. The current upward trend is characterized by a series of higher highs and higher lows—a textbook indicator of a strong uptrend.
For traders looking to capitalize on this momentum, a high-probability trade would be to consider long positions on pullbacks to the $4244.75 level, with stops placed just below this support. Targets for such trades would be the recent high, with an eye on extending gains should the market carve out new levels above the $5100 mark.
While the market’s sentiment remains decisively bullish, it is crucial for traders to monitor for any signs of weakness or reversal patterns, as these could indicate a shift in market dynamics.
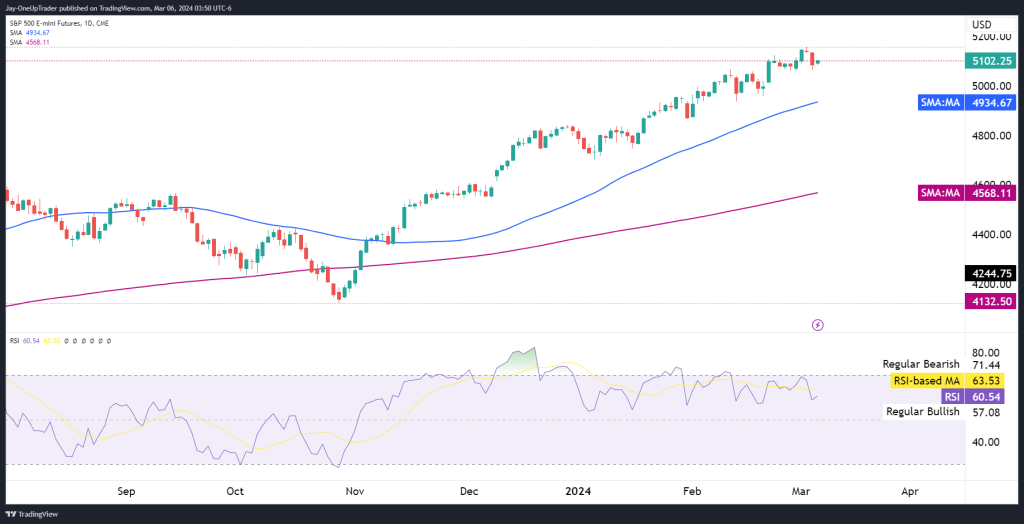
Daily Chart Price Levels on S&P 500 E-mini Futures
Price Levels to Watch:
- Immediate Support: The first level of support is at the 50-day SMA near $4934.69. A sustained hold above this level could attract more buyers.
- Secondary Support: Should the price break below the 50-day SMA, the next support to watch is the 200-day SMA at approximately $4568.12.
- Resistance Level: The recent highs around $5100 act as the immediate resistance. A breakout above this could signal a continuation of the uptrend.
Potential Trades:
- Bullish Scenario: If the price maintains above the 50-day SMA, one could consider a long position with a potential target at the recent high of $5100, placing a stop-loss slightly below the 50-day SMA to protect against downside risk.
- Bearish Scenario: If we observe a decisive break below the 50-day SMA, one could take a short position anticipating a potential pullback, targeting the 200-day SMA at $4568.12. A stop-loss should be placed above the 50-day SMA to minimize potential losses should the market rebound.