

Russell has been severely lagging the big indices with 1 year performance at 7%, while NQ has posted a 47% increase in the same period. Is it finally time for the small caps to catch up?
Weekly
- The E-Mini Russell 2000 Index Futures have been oscillating within a defined range, with the top resistance just above $2000 and major support at $1620, and minor support around $1902.8.
- The Momentum indicator has been fluctuating, which corresponds with the range-bound market conditions observed.
- The index is currently testing the upper boundary of this range, but is it going to break-out and follow the big indices?
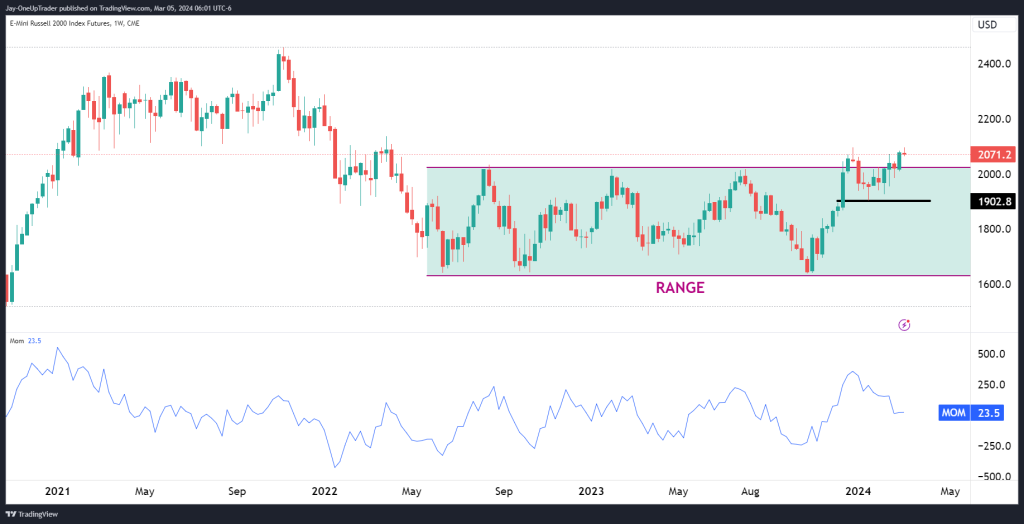
Key Levels to Watch on the Weekly:
- Resistance: The upper limit of the range just above $2000 is the key level; price is currently above this, but it needs to hold if bulls can confirm the upward strength. A convincing break above this could suggest a change from a ranging market to an upward push.
- Support: The lower range minor support at $1902.8 serves as the critical support level. If this level is breached, it could signal a bearish move all the way back down to $1,600.
Daily
- On the daily chart, we see the price pressing against the range’s resistance. Notably, there is a formation of a Doji candlestick, which is a dangerous-looking one.
- The 50-day SMA and 200-day SMA are trending upward, with the price above both.
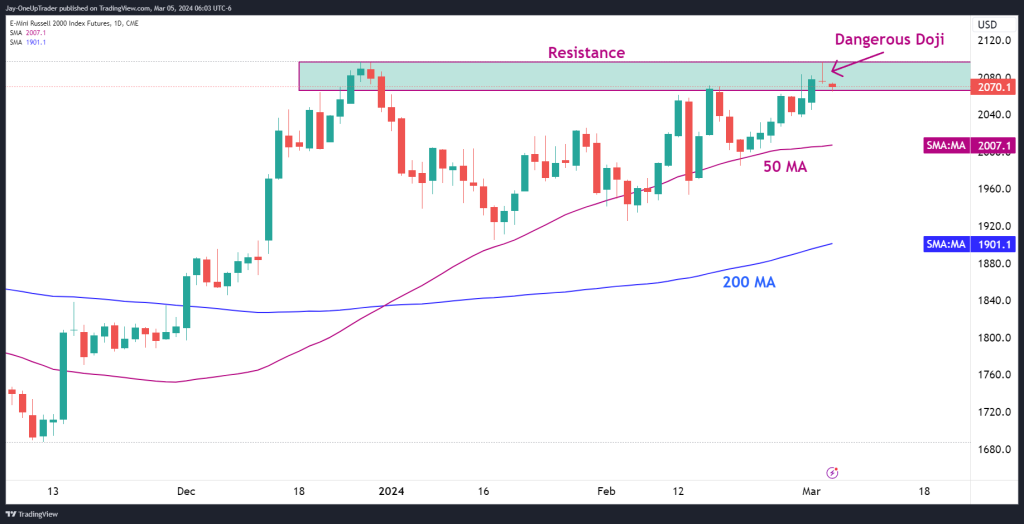
Key Levels to Watch on the Daily:
- Resistance: Along with the weekly resistance, watch for the recent highs around $2080 for any breakout attempts.
- Support: The 50-day SMA at $2007.1 could offer immediate support. Further down, the 200-day SMA at $1901.1 aligns closely with the weekly support, reinforcing its importance.
Potential Trades:
- Bullish Scenario: If we see a decisive daily close above the resistance level, it could provide a bullish entry point. Targets can be set higher based on breakout momentum, with stop losses just below the breakout level or the 50-day SMA for tighter risk management.
- Bearish Scenario: A rejection at the resistance, particularly if followed by a downward move through the 50-day SMA, could be an indication to consider short positions. Targets would be toward the lower end of the range, with stop losses placed above the range’s resistance or the recent high.
Always remember, while the Doji candlestick at resistance can imply indecision, it doesn’t guarantee a reversal. We must wait for confirmation in either direction. It’s important to manage risk and adjust positions according to the market’s response at these key levels.
