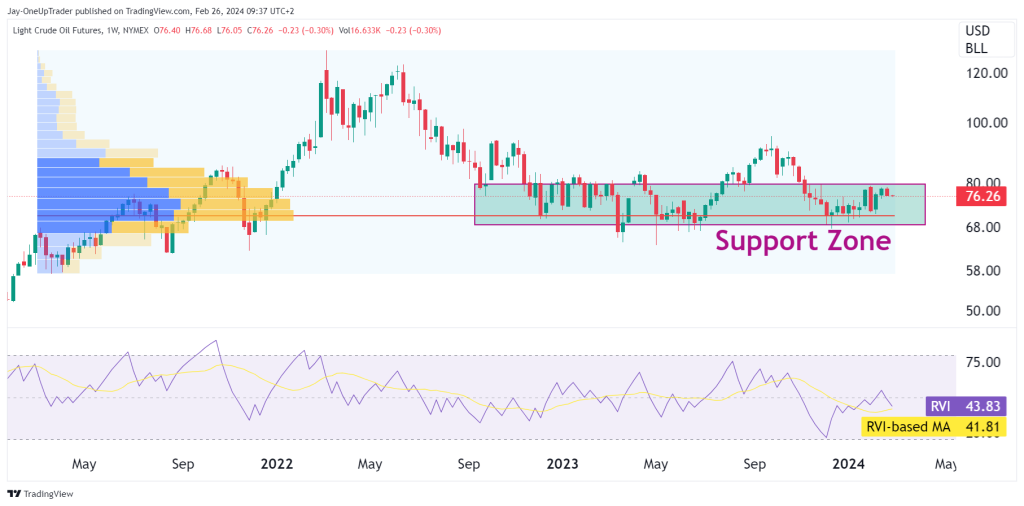
Weekly Chart Analysis
The Light Crude Oil Futures on the weekly chart have a clear consolidation pattern within a defined support zone. Volume Profile Visible Range (VPVR) indicates substantial trading activity at these levels. The Relative Vigor Index (RVI) is setting a steady momentum, with the RVI line slightly above its moving average, indicating a slight bullish bias in the medium term.
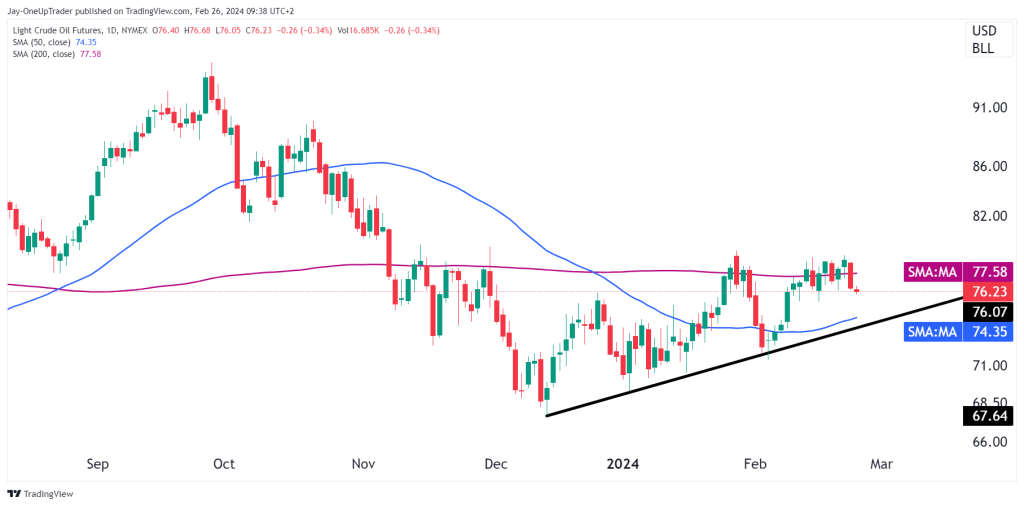
Daily Chart Analysis
On the daily timeframe, the price action is trading within the Simple Moving Averages (SMAs). The 50-day SMA at 74.35 serves as a dynamic support, while the 200-day SMA at 77.58 acts as a near-term resistance. The consolidation of these moving averages clearly shows the market is sitting sideways. The trendline support, drawn from the lows, adds to the bullish structure.
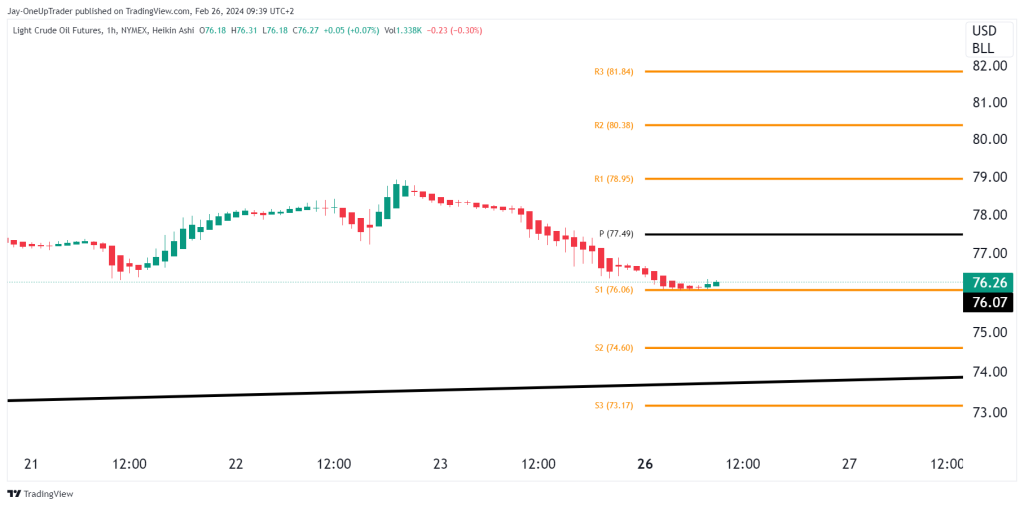
1 hourly Chart Analysis
The hourly Heikin Ashi chart shows a consolidation above the pivot point of $77.49, with immediate support and resistance levels at $76.06 and $78.95.
Key Levels to Watch
The critical levels on the Light Crude Oil Futures are as follows:
- Support Zone: $76.00 to $76.26, where buyers have consistently entered the market.
- Resistance Zone: $80.00 to $81.84, which has capped previous rallies and is the target zone for bullish breakouts.
Potential Trades
For traders looking to capitalize on the current market structure, long positions could be initiated at the lower boundary of the support zone with a stop-loss placed just below $76.00. The primary target for this bullish trade is the lower boundary of the resistance zone at $80.00, with a further extension to $81.84 should momentum persist.
Rating
Based on the current technical configuration, I am maintaining a bullish rating on Light Crude Oil Futures. The affirmation of support levels, combined with the potential for a bullish SMA crossover and the RVI indicating slight bullish momentum, provides a confident basis for expecting upward price action. It is crucial to monitor the market’s reaction at the key support zone to confirm the bullish stance, with any break below this level necessitating a re-evaluation of the bullish outlook.