


Weekly Chart
The weekly time frame shows that price is approaching the previous all-time high, a big milestone for Bitty. The swing high extensions (Swing:SH Ext at 32165) serve as a reference point for potential resistance on further moves up. This swing indicator will likely print a higher low soon around $40,000.
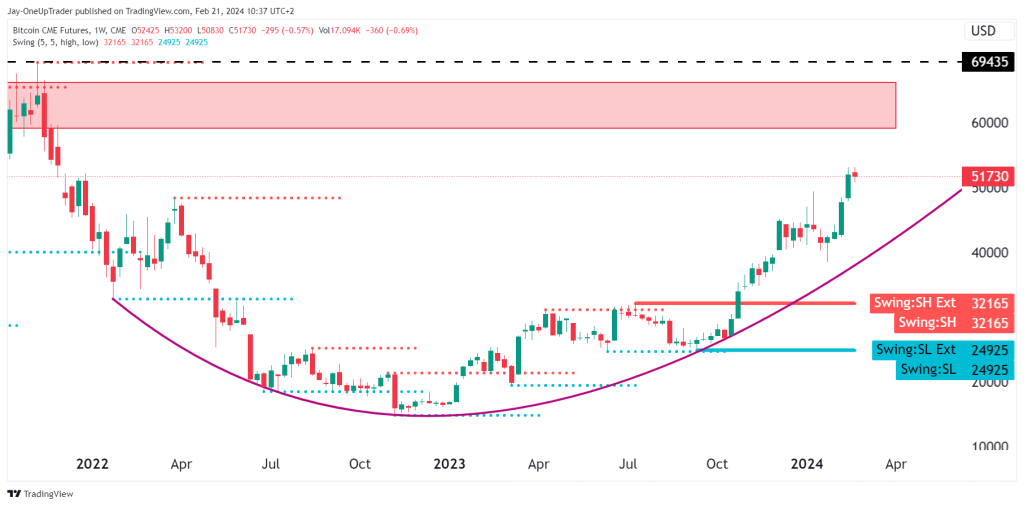
Key Levels to Watch on the Weekly:
- Resistance Zone: The area around 69000 is a significant zone of resistance where we could expect sellers to come in.
- Support: The swing low extension (Swing:SL Ext at 24925) would be the next significant level of support if a downtrend is confirmed. (unlikely at the moment)
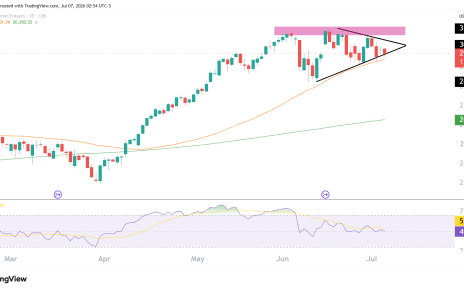
Daily Chart
Price is sitting above both the 50-day SMA (4437) and the 200-day SMA (33604). Price did pull back to below the 50 MA but bulls stepped in as the new bull market in BTC is here and confirmed. The question is how high can it go? Some are calling for 100K and some as high as $300K by year end. What do you think?
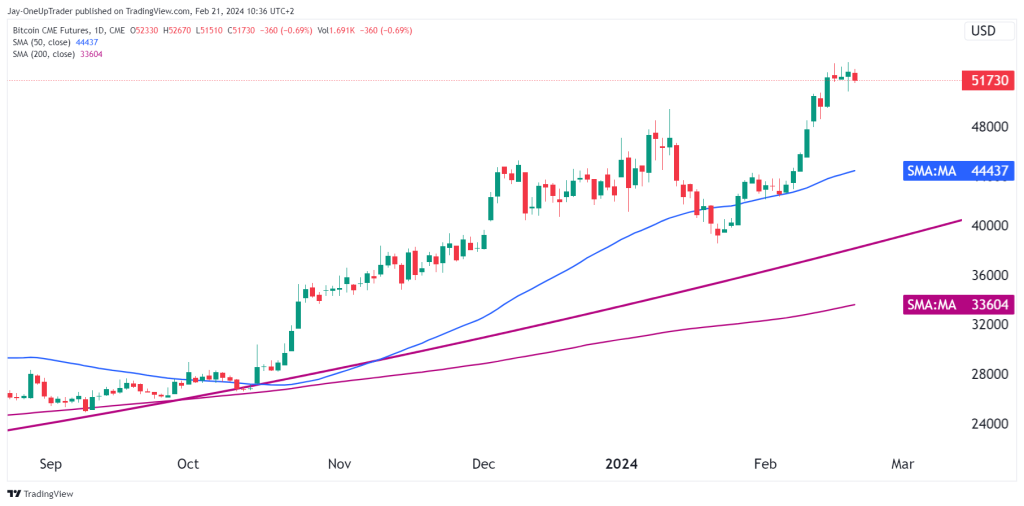
Key Levels to Watch on the Daily:
- Resistance: The recent high at around 51730 serves as the immediate resistance level where we could see consolidation come in.
- Support: The 50-day SMA at 4437 is the first critical support level, with the 200-day SMA at 33604 acting as a major line of defense for a deeper retracement.
Hourly Chart Analysis:
The 1-hour Heikin Ashi chart shows a consolidating market with price action hovering around the pivot (P) level at 49165.
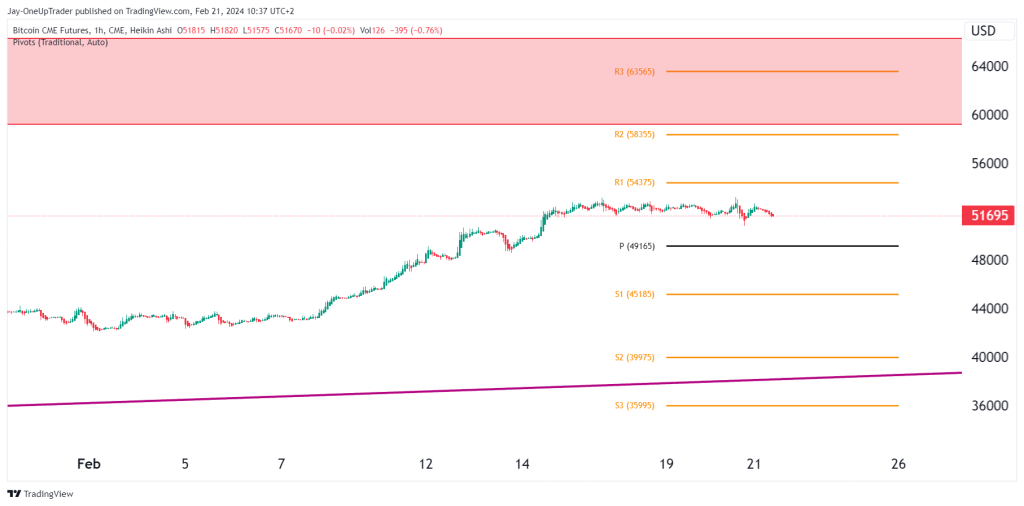
Key Levels to Watch on the Hourly:
- Pivot Point (P): The 49165 level is pivotal. Holding above it means buyers are still in control.
- Resistance 1 (R1): At 54375, overcoming this level could lead to testing the daily high resistance.
Potential Trades:
Bullish Trade Setup:
- Entry Point: Look for a rebound off the pivot point at 49165, or a decisive breakout above the current consolidation zone.
- Stop Loss: A stop loss could be placed just below the 50-day SMA at 4437 to protect against a false breakout or a return to the bearish sentiment.
- Take Profit: Initial profit targets could be set near the recent high at 51730, with the potential to extend gains if the price action convincingly breaks through this resistance.
Rating
Our rating is bullish. Adjust the size of your positions according to the stop loss to ensure you are not risking more than a small amount of your evaluation account. Stay vigilant to changes in the market conditions that could invalidate the trade setup.