

Weekly Chart
The weekly chart has formed spinning tops near the recent all-time high. This tells us that there is indecision in the market. The RSI is currently overbought at 71.31. before the formation of the spinning tops there was only 1 red week out of 14. This amount of bullish price action cannot last forever, which explains why we see the spinning tops forming and a possible consolidation or retracement on the horizon.
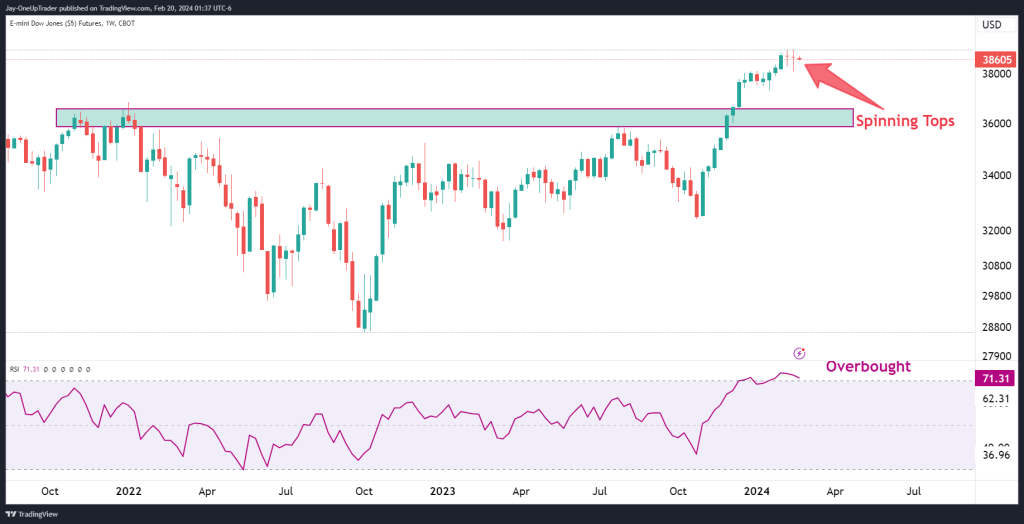
Key Levels to Watch on the Weekly:
- Resistance: The area around 38700 is acting as a ceiling for the price. A definitive break above this could signal continuation, but the overbought RSI warrants caution and the lengthy up trend that we have seen.
- Support: The next significant level of support lies in the zone around the previous consolidation area, at around 37000.
Daily Chart
On the daily timeframe, there is a bearish break in the trend line. The price is hovering above the support level which could catch prices if we see a drop from here.
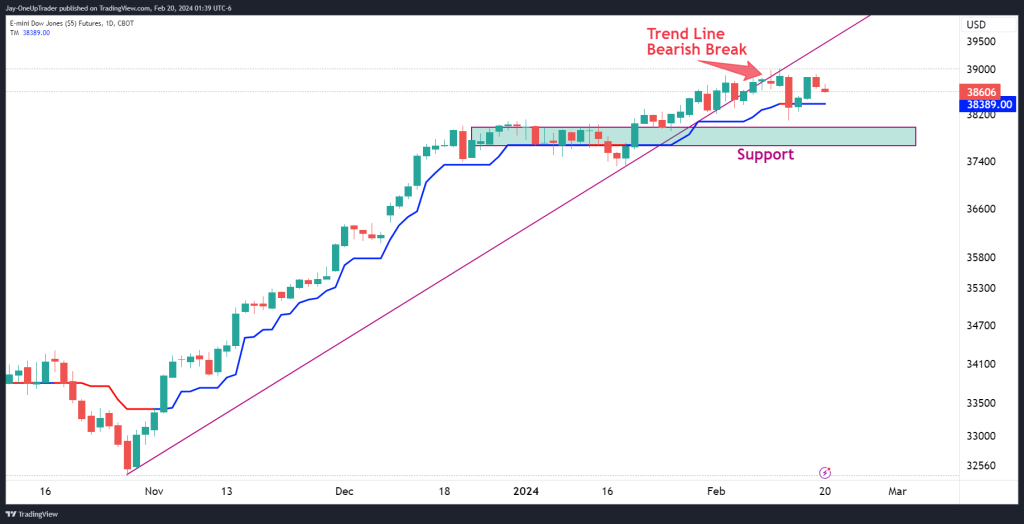
Key Levels to Watch on the Daily:
- Immediate Support: The TM at 38389.00 is key, and we should watch for potential bounces off this level.
- Break of Support: A close below the TM could accelerate selling pressure, potentially targeting the support zone.
Hourly Chart
The hourly Heikin Ashi chart magnifies the consolidation phase, with the price oscillating around the pivot point level.
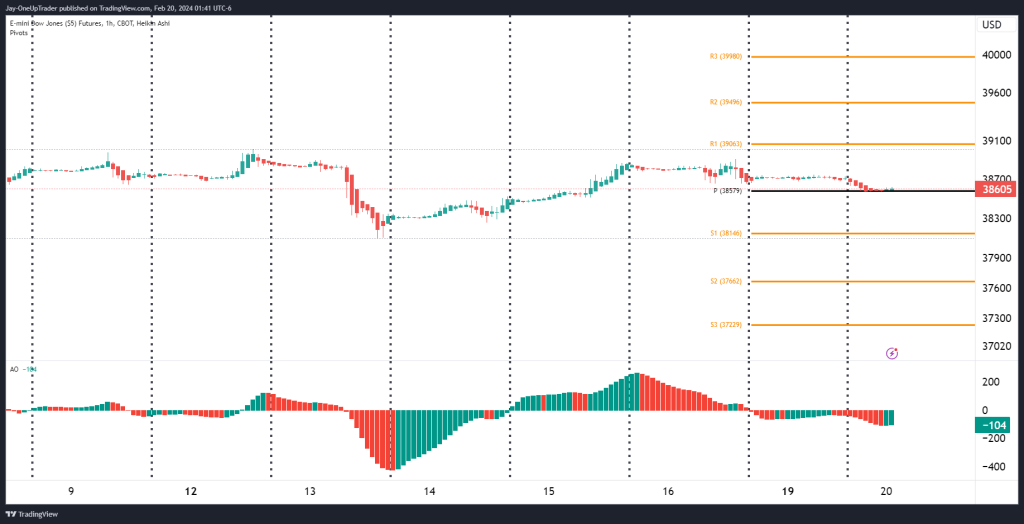
Key Levels to Watch on the hourly:
- Pivot Point (P): The level at 38579 acts as an immediate indicator of sentiment. Holding above is necessary for bulls to regain control.
- Resistance 1 (R1): The 38663 level could see a retest if buyers step in with enough volume.
Potential Trades:
- Bullish Scenario: If we see strength and a hold above the TM at 38389.00, a long position could be initiated, with a stop loss placed below the recent low and targeting the 38605 resistance.
- Bearish Scenario: A break below the TM at 38389.00 would open a short opportunity, targeting the next support level with a stop loss just above the TM.
Final Thoughts:
Despite the current bearish signals such as the RSI overbought conditions and the break of the daily trend line, the overall market structure remains within an uptrend. We are cautious but not bearish until further confirmation. A prudent strategy would be to wait for a clear directional signal at the TM level on the daily chart. Should the TM hold, we could see a resumption of the uptrend; a break below could signal a deeper retracement. Stay vigilant and ready to act.
