- NQ surged towards all-time high on July 21st, followed by a 5.7% pullback, prompting strategic considerations for future movement.
- Steady uptrend in NQ observed, potential for trades within rising trend channel.
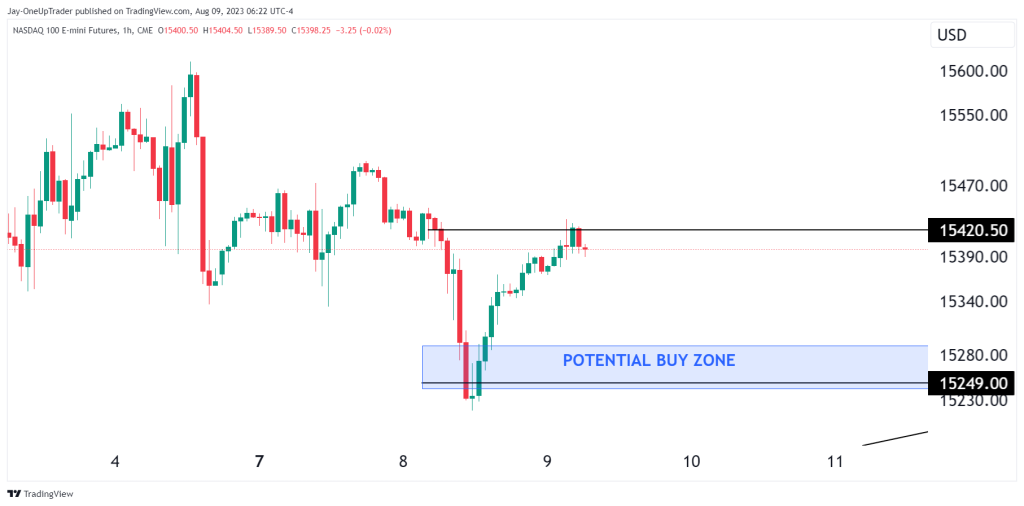
- Possible trade opportunities on the hourly chart.
Recap
The last time we looked at NQ was July 21st. Price was surging toward resistance at the all-time high of $16767. NQ dropped shortly after that article, not making another high since then. We have seen a healthy pullback of 5.7% since then, so the question arises, what is the best way to play NQ moving forward?
Technical analysis
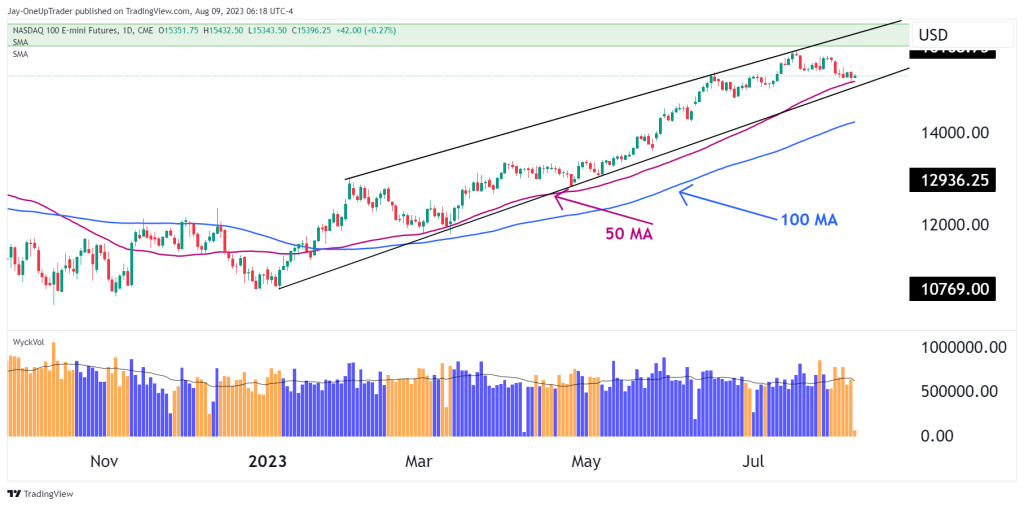
There are a few important factors on the chart I would like us to focus on. The first is the fact that the uptrend we have seen in NQ has been steady and predictable since the beginning of the year. Some might say that the opportunity to go long has been missed but if we look at a shorter time frame, there may still be trades that we can take.
There is a rising trend channel that we can begin to monitor. However, we will need to wait and see if price will find support off the lower ascending trend line. Currently, the market seems to find some support off the 50-moving average. It might be too early now to take a long trade, as we could see price remain sideways for a few more days. If we grind down to a lower time frame and see a double bottom or consolidation phase occur, that could signal us to enter long with a stop below that local bottom. This is something I would wait for.
One more indicator we can take note of is the volume. If we notice a slight drop in volume, that would be a bullish sign, as an accumulation phase could shortly follow.
I have attached a daily chart and an hourly chart. Take note of the hourly chart for the consolidation phase I would be watching for.