Introduction
Bond buying has been going crazy since the start of the conflict in the Middle East, and anyone trying to catch a falling knife now has been burnt badly. Let’s take a look at all time frames to get an idea of how we can take advantage of these market moves.
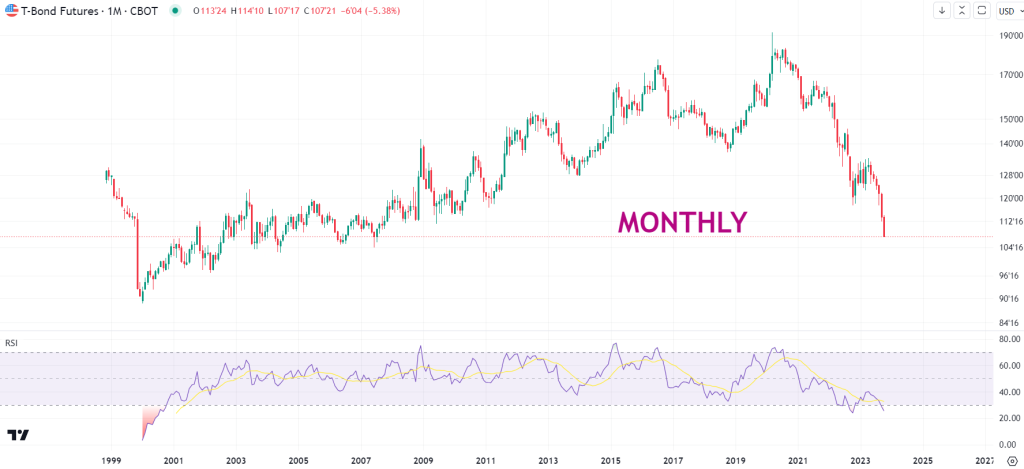
Monthly Chart
The monthly time frame looks like a waterfall as price continues to fall through support. The RSI is oversold now, but it can stay like that for some time. We won’t find any trade opportunities on the monthly chart, but we can confirm it is bearish.
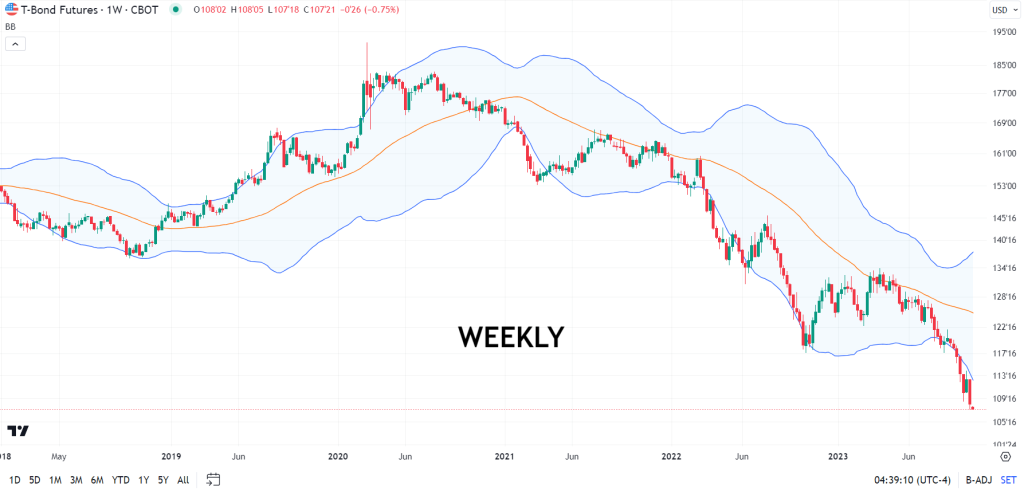
Weekly Chart
The weekly chart also shows some signs of it being oversold, but the bollinger bands indicator puts things into perspective when set on the 50 moving average. There is resistance at 50 so traders who are looking to short the futures contract but hold it longer term can wait until a retracement occurs to the 50 before getting involved.
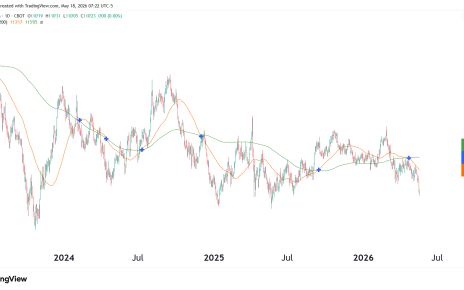
Daily Chart
The daily chart shows us clearly the sell-off and bears can wait for any sort of short-term rally to take shorts, even if they are short scalps.