Introduction:
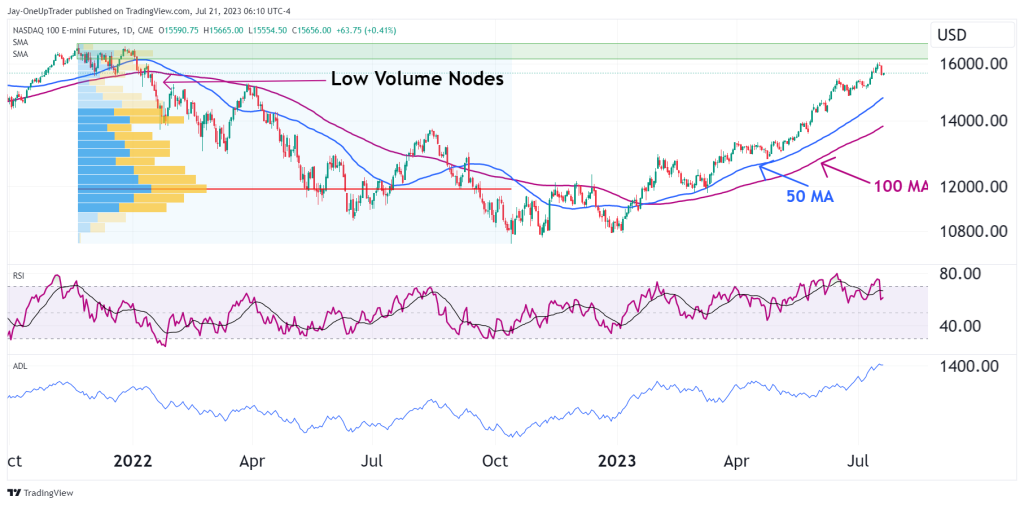
NQ has shown remarkable resilience, surging 53% since its lows in October last year and currently hovering only 7% below its all-time high. With the 50-day moving average sloping upward and the Relative Strength Index (RSI) sitting at 60, bullish momentum is evident. Moreover, the Accumulation/Distribution Line (ADL) is at 1400, indicating increased buying pressure. While trading inside a low volume node according to the volume profile indicator, NQ faces a resistance zone around 16000, but the absence of significant bearish patterns highlights a robust uptrend. This analysis emphasizes the potential for long trades on pullbacks within this strong bullish trend.
Technical Analysis:
- Uptrend: Nasdaq Futures have seen a remarkable uptrend, gaining an impressive 53% since the lows seen in October last year. Such strong and sustained upward movement clearly indicates bullish sentiment in the market.
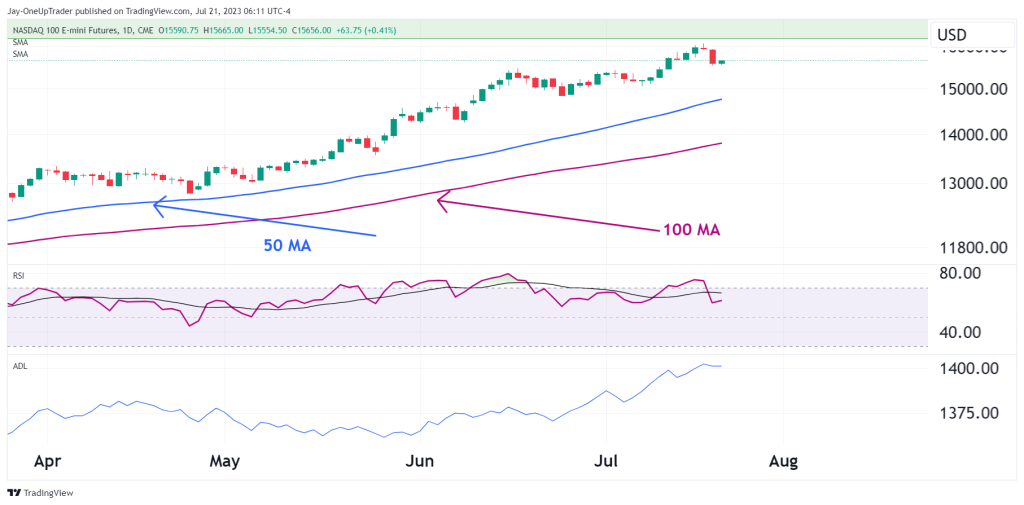
- Moving Averages: The 50-day MA upward slope confirms the presence of strong bullish momentum. The fact that the price remains well above this moving average further reinforces the positive outlook for NQ.
- Relative Strength Index (RSI): The RSI currently sits at 60, indicating that NQ is neither overbought nor oversold. This suggests a balanced market sentiment and potential room for further upside.
- Accumulation/Distribution Line (ADL): With the ADL standing at 1400, there is a clear increase in buying pressure. This suggests institutional investors and traders are accumulating positions in NQ, supporting the bullish case.
- Volume Profile: The price trading within a low-volume node indicates low liquidity. We could continue to see NQ move swiftly through this.
- Resistance Zone: A resistance zone is observed just above 16000, coinciding with the all-time high level. While it may present a temporary hurdle, the strength of the overall trend suggests the potential for a breakout in the near future.
Trading Opportunity:
Given the strong bullish trend in NQ, there is no bearish case to justify short trades. Instead, long trades could be considered on pullbacks within the uptrend. Traders may look for price retracements towards key support levels or the 50-day moving average to enter new positions with favorable risk-to-reward ratios. If a break occurs above the all-time high, we will move into unchartered waters and fresh price discovery.
Ending Off
NQ has demonstrated an impressive uptrend, gaining 53% since its lows in October last year. The technical indicators support continued bullish momentum. Though facing a resistance zone near its all-time high, the absence of significant bearish patterns and the trading within a low volume node suggests the potential for further upside.