

- Investors are waiting for clues on the ECB’s policy plans.
- 10-year Treasury yields crossed the 3% mark, pointing to an increase in interest rates.
- The index is caught in a sideways move on the 4-hour chart.
Nasdaq 100 (NQ) futures pushed lower on Thursday before the ECB meeting, with investors nervously waiting for clues on the central bank’s policy plans. Global markets weakened ahead of the decision. US stock futures fell while the dollar went up to 20-year highs. The jump in oil prices fanned inflation worries.
“The 10-year Treasury yield is up over 3%. That’s probably part of why we’re seeing a drawdown in the market today. That level is what people are focused on because it represents an increase in interest rates and a reflection of inflation and market volatility,” said Robert Pavlik, senior portfolio manager at Dakota Wealth, referring to yesterday’s move.
Investors ramped up their bets on ECB hikes after last week’s higher-than-expected inflation report. Several policymakers are open to a 50-bp hike.
“It seemed inevitable that 50-basis-point hike bets would become more popular given that the ECB is widely perceived as being behind the curve and other central banks have started to move in 50-basis-point increments as well,” said Antoine Bouvet, senior rates strategist at ING. The Reserve Bank of Australia is one of the banks that recently raised rates by 50bps.
He added that most investors would be waiting to see if the ECB could deliver on hawkish expectations. The markets might remain nervous throughout the meeting.
The markets are also waiting for the US inflation data that will be released tomorrow. It is widely expected to be elevated and will be important in pointing at the Fed’s next move.
Nasdaq 100 Futures technical forecast:
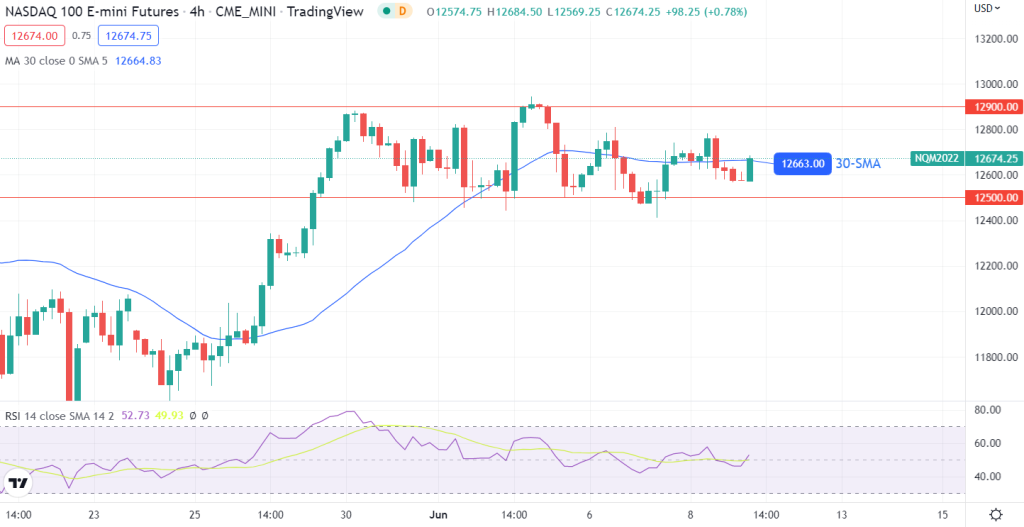
On the 4-hour chart of NQ, we can see price trading sideways between 12900.00 and 12500.00. The price is chopping through the 30-SMA, and the RSI is trading above 50, showing mild room for upside. The short-term bears are pushing the price to retest range support and see if they can break below it this time.
A break below the support could see the bearish trend resuming and the price trading below the 30-SMA. However, a break above range resistance could see bulls push the price higher.
