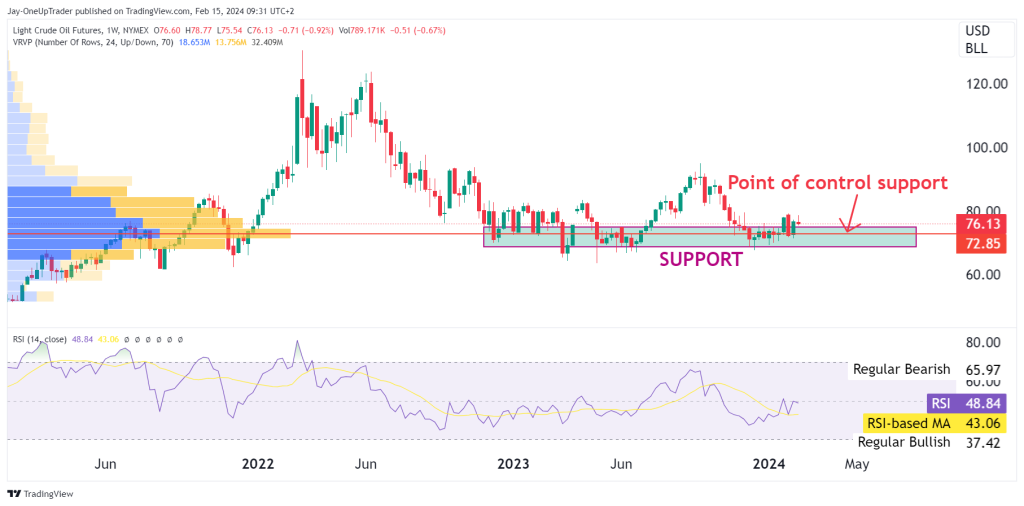
Light Crude Oil Futures (Weekly Chart):
- Support Level: The support zone around $72.85 is pivotal. We can anticipate that if the bulls maintain strength, they want to defend this level. A break below this, could signal further downside.
- Point of Control: At $76.13, the point of control indicates a significant price level where the most volume has been traded over the observed period. Holding above this level likely leads us to continued upside.
- RSI Indicator: The Relative Strength Index (RSI) is hovering around 48.84, which is neutral. Something common to see after a consolidation period.
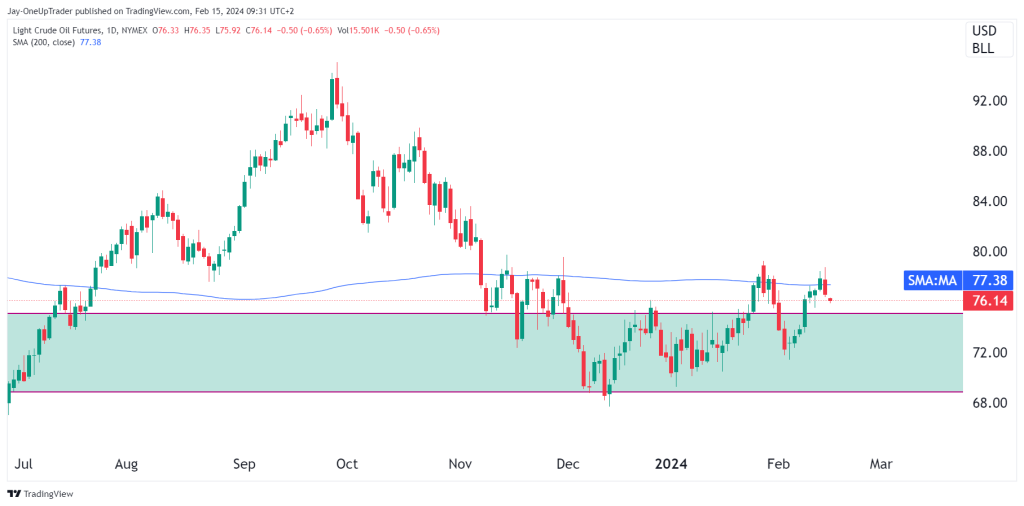
Light Crude Oil Futures (Daily):
- SMA Indicator: The 200-day Simple Moving Average (SMA) at 77.38 will be a key level to watch. As long as prices stay above this moving average, the overall trend is considered bullish.
- Resistance Level: The 200 SMA is flat and price is hovering around it, bulls need to see the support zone hold and then push above the 200 MA and hold above it in order to target $90 oil.
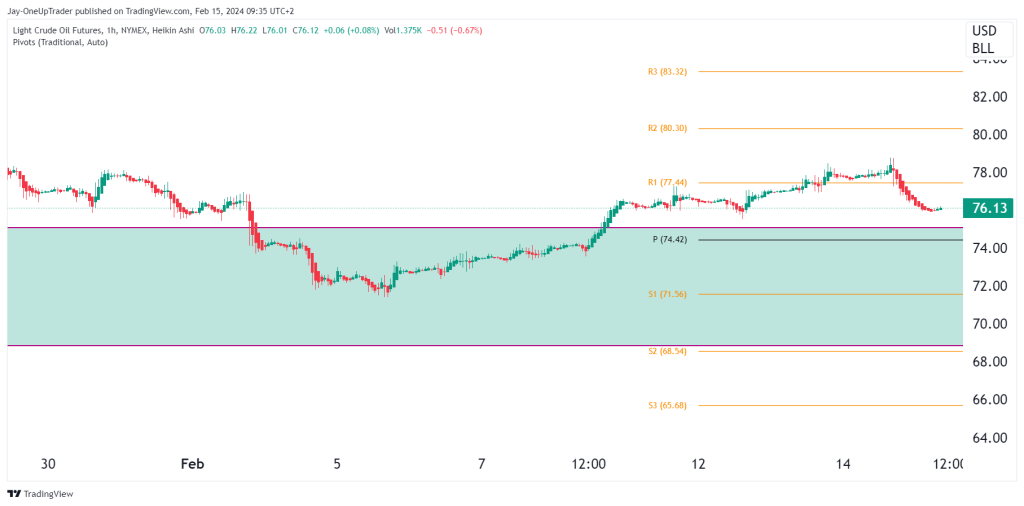
Key Levels and Analysis:
- Pivot Point (P): The pivot point at $74.42 serves as the baseline for the session. The price action around this level will be crucial to determine the immediate direction. If the price maintains above this level, it suggests a bullish sentiment, and if it falls below, bearish sentiment may prevail.
- Resistance Levels (R1, R2, R3): The first resistance (R1) lies at $77.44, which could act as a short-term ceiling. A break above R1 could lead to a test of R2 at $80.30, and potentially R3 at $83.32. These levels may act as potential profit-taking zones if the price rallies.
- Support Levels (S1, S2, S3): The first support level (S1) is at $71.56, a break below which could see a move towards S2 at $68.54, and in a more pronounced downtrend, S3 at $65.68 could come into play.
Trade Considerations:
- For Bulls: If you are bullish on oil, consider entries above the pivot point ($74.42), targeting R1 ($77.44) for an initial take-profit level. Keep a watch on the volume and price action to confirm bullish strength.
- For Bears: If you are bearish, look for a sustained break below the pivot point, with potential short entries aiming for S1 ($71.56). Ensure to set a stop-loss above the pivot point to mitigate risk.
Market Sentiment:
- Volume: Pay attention to the volume as you approach these levels. Increasing volume at support or resistance levels could indicate a stronger likelihood of a price reversal or breakout.
- Price Action: Look for candlestick patterns such as hammers, shooting stars, or engulfing candles around these key levels to further inform your trades.