- We look at how beneficial it can be to set profit targets correctly without being greedy.
- How we can learn from our trade mistake from last month in RTY.
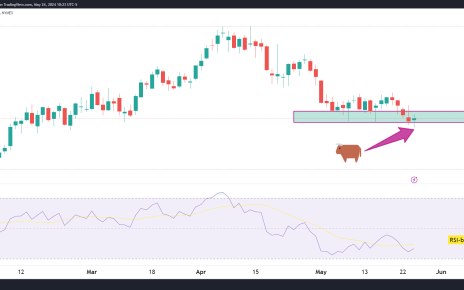
- Volume profile shows current prices are within a high volume node providing support and the higher we go, the lower the liquidity is.
Russell 2000 RTY
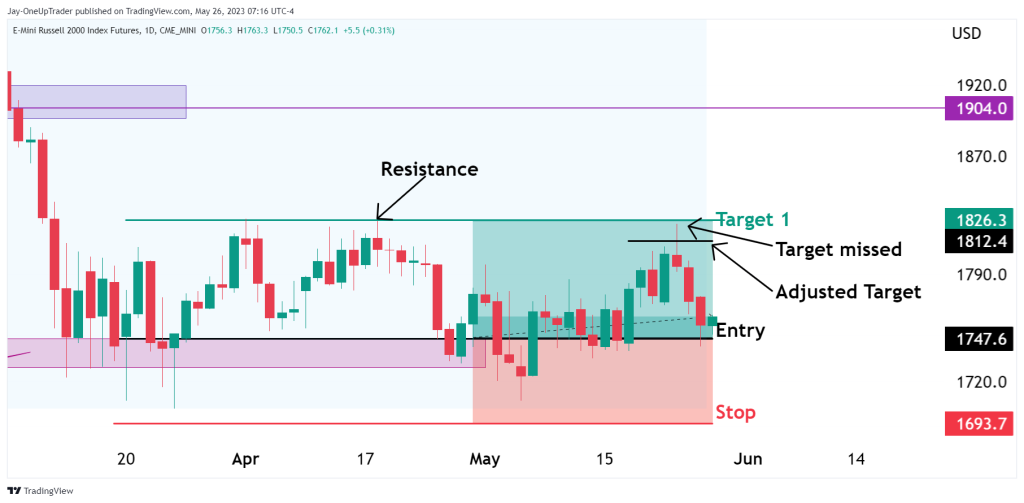
On April 28th, there was a long trade opportunity with an entry price of $1,747.6, a profit target of $1,826.3, and a stop loss of $1,693.7. The market has rallied since then, just missing our target by a few ticks, and has now dropped back to the original entry price.
Before we look into the technicals of the RTY, I want to focus in on something we can learn from this type of trade. The target we set on April 28th was at the very top of a resistance level. What we should have done was adjust the target lower instead of trying to go for a maximum move, especially since our target was above resistance. This means there would be additional selling pressure before our take profit would have been reached. Moving forward, we can learn from this by adjusting our targets slightly, lowering our profit but having a higher chance of them getting hit. Ideally, if the target was set at $1,813, it would have been a smarter decision than at the level of $1,826.3. Look at the chart below for reference.
If we treat trading like this, by always looking at ways to improve and what we could have done better. We will be on the right track. There is no point in getting upset when something like this happens because then we will be likely to repeat the same mistake in the future. Instead, let us learn from it, so we improve our performance each day.
Volume profile analysis
RTY is currently trading within a high-volume node. There is plenty of liquidity here, which is why we have seen support at current prices of $1,760. If we see a rally from here, and we take out the highs at $1,820, then we enter into a low-volume area, as shown in the chart below. Generally, price moves through high-volume nodes quickly because the liquidity is limited, so we can say that a big price move could be on the cards if that is the case.