- Long, medium, and short-term charts pointing to potential short
- Limited upside potential if the bear case does not play out
- Dynamic Money Flow Showing Weakness
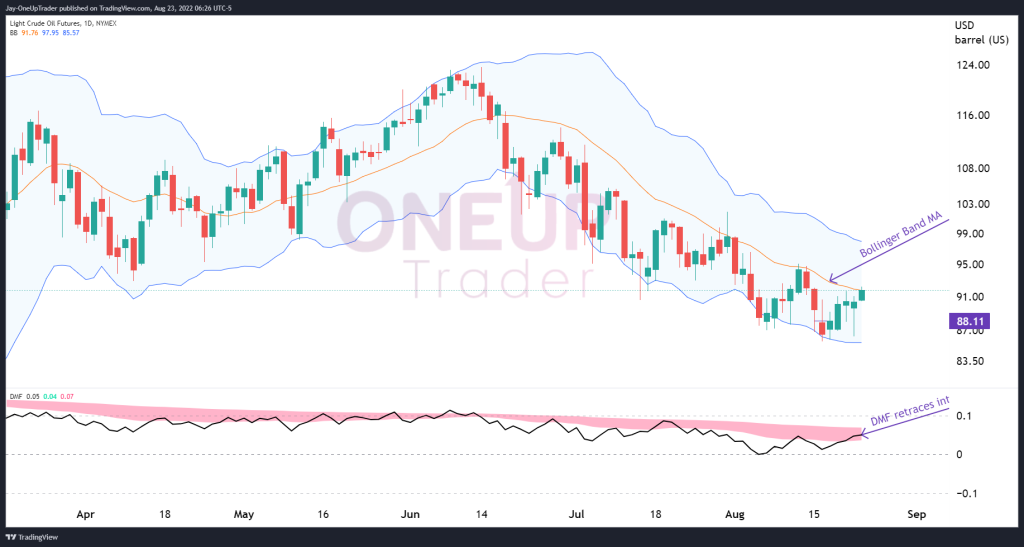
Medium-term picture
Crude Oil futures (CL) has been in a beautiful downward trend since mid-June, giving multiple short entries for those patient enough to wait for retracements. We are approaching an opportunity like that right now with probabilities in the bear’s favor. However, as the saying goes, nothing is guaranteed in trading.
Looking at the daily chart with a Bollinger bands indicator, we notice how the moving average, the orange line, has been acting as a strong resistance point all the way down.
The Dynamic Money Flow index has also retraced into its moving average, giving signs of possible shorts around these prices. There is a possibility, however, that CL will rally toward the upper Bollinger band, but that would be the first time since the down move began and that the moving average failed to hold its resistance.
The two-hour chart gives us a great idea of how many short entries we have had on this move using the trend channel indicator based on the daily time frame. A simple pullback entry trade with a wide enough stop loss has yielded 4 out of 5 winning trades thus far.
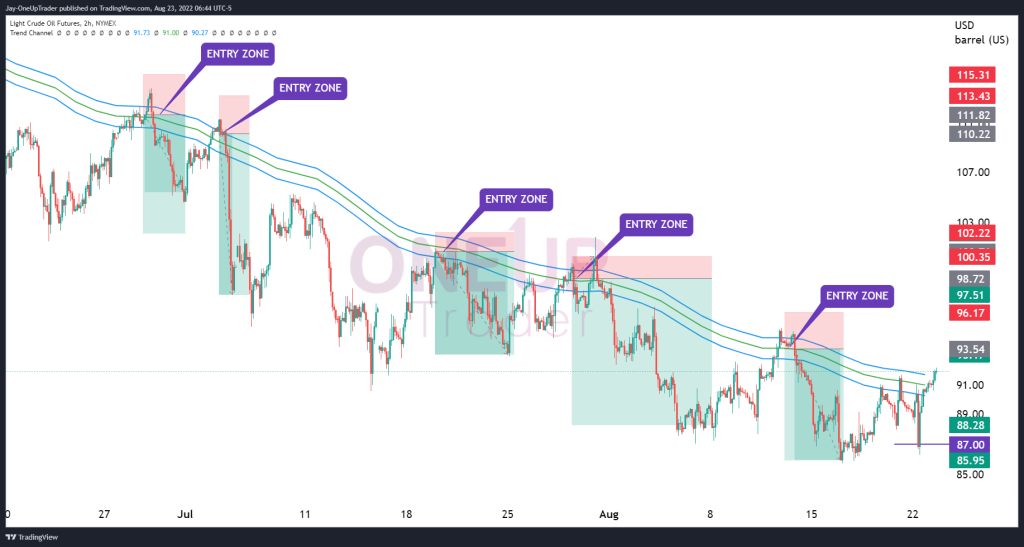
CL is currently trading within the trend channel, which could signal that the retracement is deep enough to consider taking a short trade now. Price targets for crude oil are $87 if the Bearish case plays out.