- YM has dropped 5% from its local top made at the beginning of May, and technical analysis indicates that we have further to go.
- Volume profile indicates less liquidity moving down in price, which could accelerate a sell-off.
- Pivot points give us potential turning points in the market if price action continues in a bearish fashion.
Technical analysis
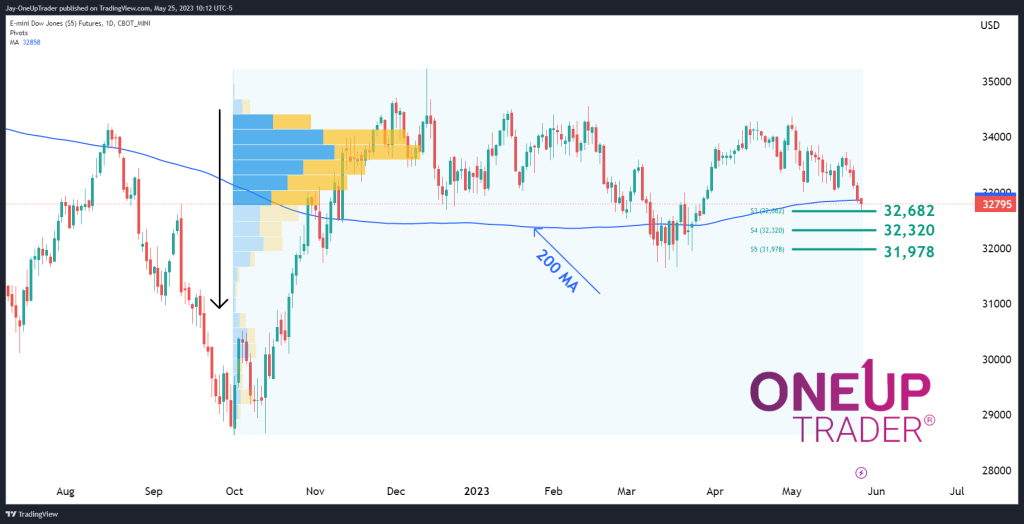
YM has rolled over since the most recent local top made at $34,373 from the beginning of May. We have seen a dip of 5% which is not significant, but the price action tells us the bearish momentum may still have further to go.
The 200-day moving average is being tested at the moment, as seen in the chart below. There may be some support off this level as long-term traders begin to enter into long positions.
The main reason I see a higher probability of price moving lower from here is that the volume profile is showing us liquidity is getting thinner the lower we go. Price generally moves quickly through low-volume nodes in the volume profile because there is an insufficient amount of liquidity to support prices. I show the reduced liquidity with the black arrow on the left-hand side of the volume profile.
The pivot points also give us targets to aim for, with the very last one at $31,978. That would require a lot of selling pressure to send the market lower. That could be the last stop before we see a reversal in price, but we need to monitor price action closely if it does, fact approach that level.