



Introduction
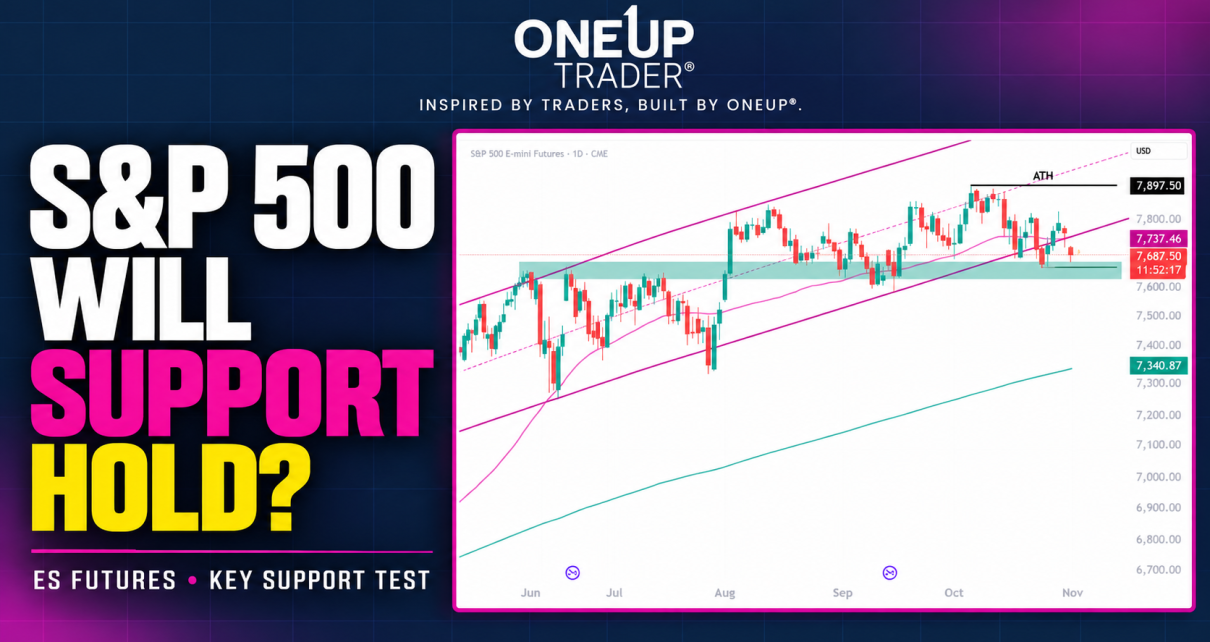
The S&P 500 is only trading 2.8% from the all time high. The trend is a very slow, almost sideways grind; there is just not a lot of buying happening, but at the same time, minimal selling too, which is why we see the market move this way.
There is a possible long trade showing itself now, though, so let’s take a closer look.
S&P 500 technical analysis
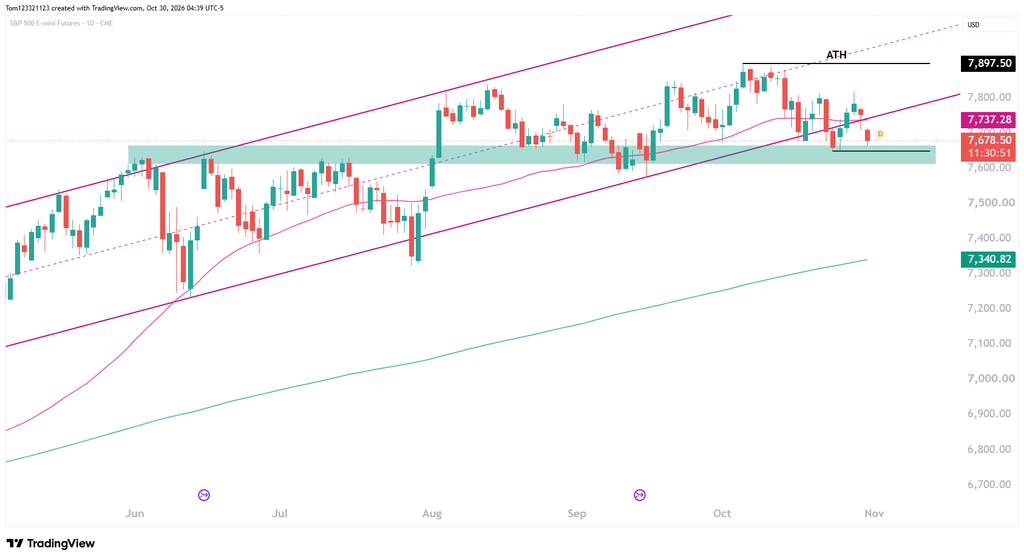
There is a support band between 7,600 and about 7,680, which price is testing now. This zone is a strong one because it has switched a few times between resistance and support. The first point was marked in early June, and it’s been tested a total of eight times since then on the daily chart.
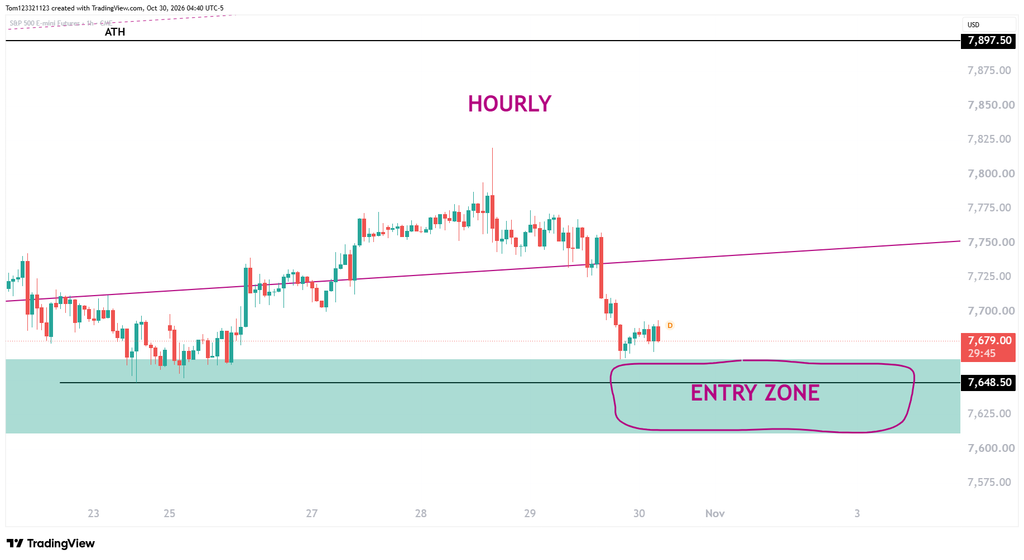
Price is moving into this zone now (30 October), and if we grind down to a shorter time frame and see a reversal pattern like an H&S or a double bottom, it could be a strong entry signal to go long.
S&P 500 possible trades
Long trade: Looking for a reversal inside the support zone on the hourly chart, a double bottom, H&S etc. Or even accumulating slowly inside the support zone with a stop placed below the swing low.
Disclaimer: Educational content only; no personalized investment or trading recommendation is intended. Futures carry substantial loss risk and may be unsuitable for some traders. Examples are hypothetical and do not predict results. Stop orders cannot guarantee an execution price. Evaluation requirements and payout terms vary and may change; consult the provider’s current rules.