

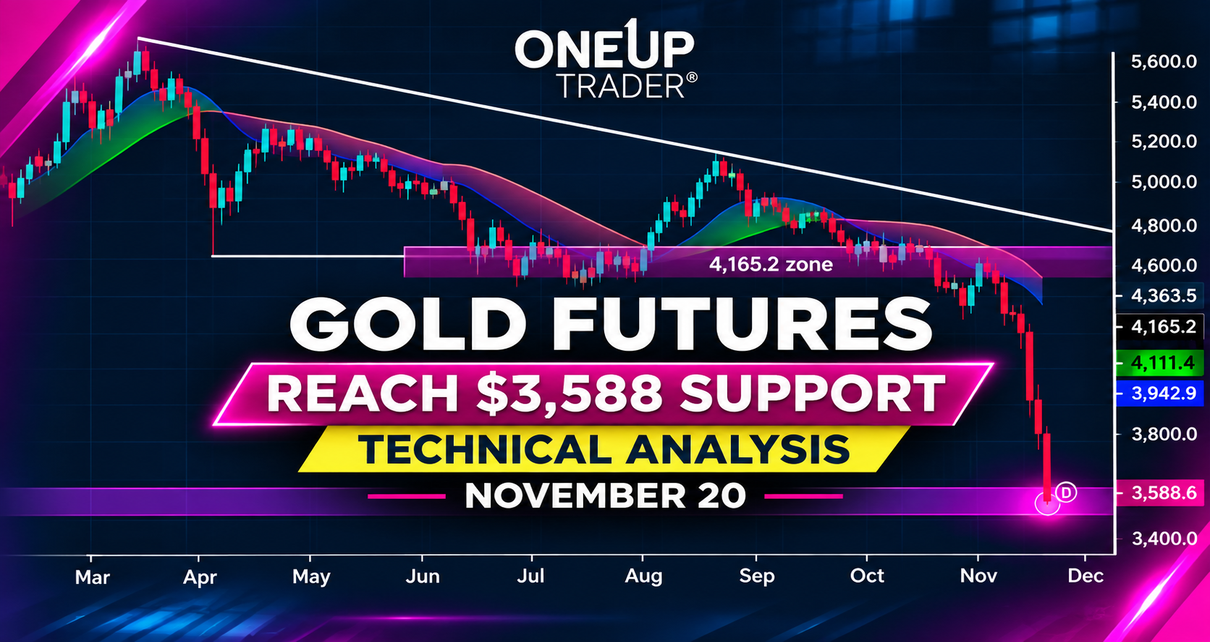
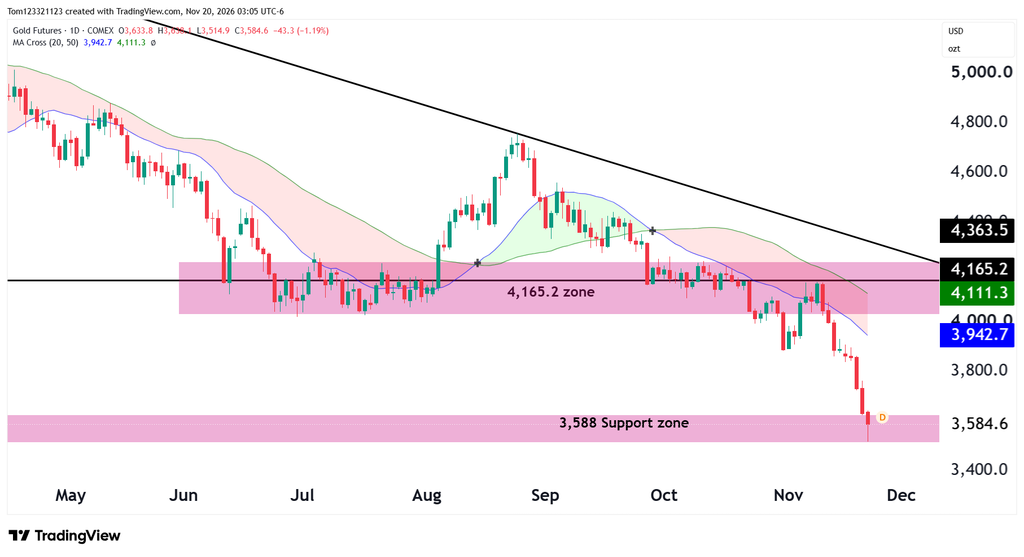
In our November 18 gold technical analysis, we noted $3,588 as the next support zone after gold lost $4,000. It was the area where gold spent much of the summer of 2025 before breaking higher.
Gold futures traded as low as $3,514.90 on Friday (20 November 2026) and have settled inside the support zone.
Possible Gold GC trades
Long setup: For a possible long, watch for an hourly close above $3,638.10, with a stop below the first pullback in the new hourly uptrend, or below $3,500. The first upside target will be $3,760–$3,800. This would still be a trade against the daily downtrend.
Keep an eye on small pullbacks if price clears above $3,638.10. A buy order doesn’t have to be placed right away at that price; we can wait for pullbacks up toward the $3,760 target and set stops below those pullbacks to gain a higher risk-reward ratio.
Gold Technical Analysis
The 50-period moving average is below the 200-period moving average, and price is well below both of them. GC has been in a free fall as the Dollar increases in strength and high-probability rate hikes are coming in the near future.
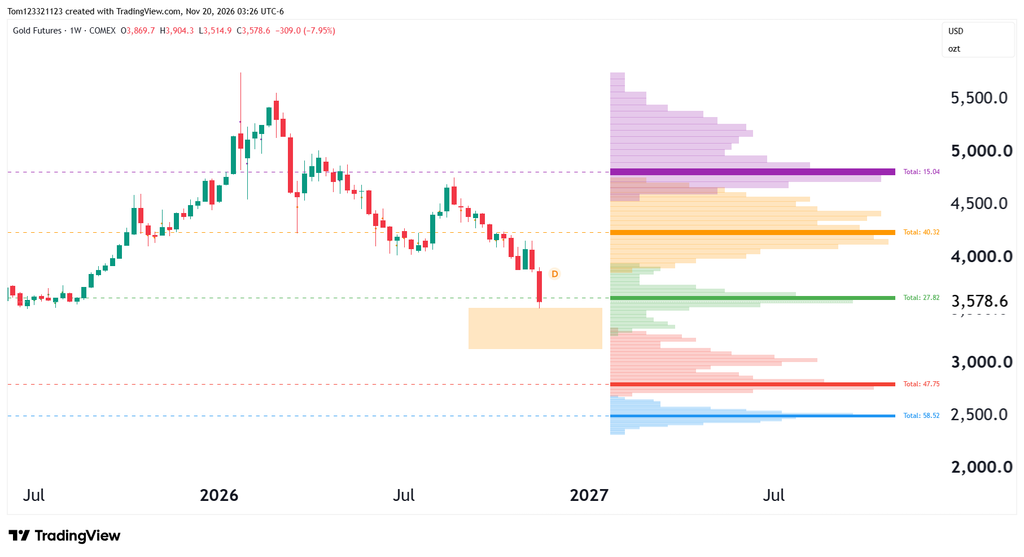
Look at the chart above; If GC closes below $3,500 and buyers can’t reclaim it on the next bounce, the decline could pick up speed. This is because it is going to be trading inside a thin band of liquidity (a low volume node), and because markets go towards liquidity, not away from it, we could see the price drop rapidly to around $3,000, where the next high liquidity zone exists.
This low volume node is between $3,150 and $3,500.
With GC trading inside of a major support zone now, bulls need to gather all the strength they have to stop the decline.
For educational purposes only. Futures trading involves substantial risk.