

Technical Analysis
ES has been in an uptrend this year, and after a sizeable pullback of 8.8% from the recent local top, it appears that the low might be in and could be the opportunity that bulls have been waiting for.
Yesterday (Monday, October 10) price action formed a morning star candlestick pattern, and if today’s price action confirms the formation, the low could certainly be in.
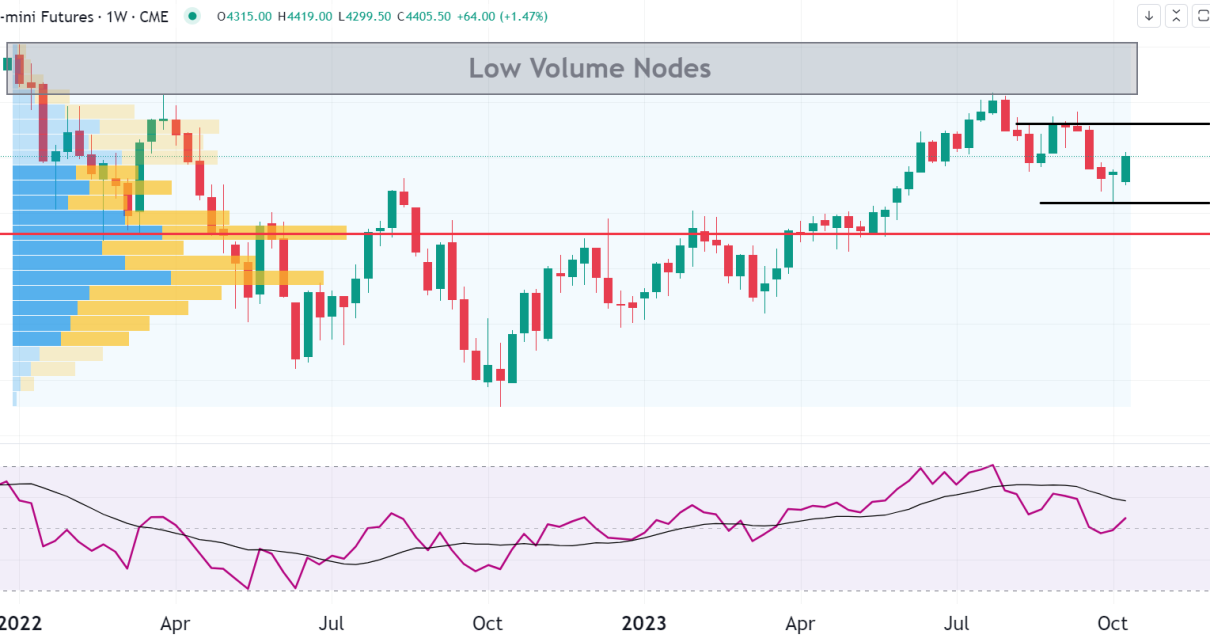
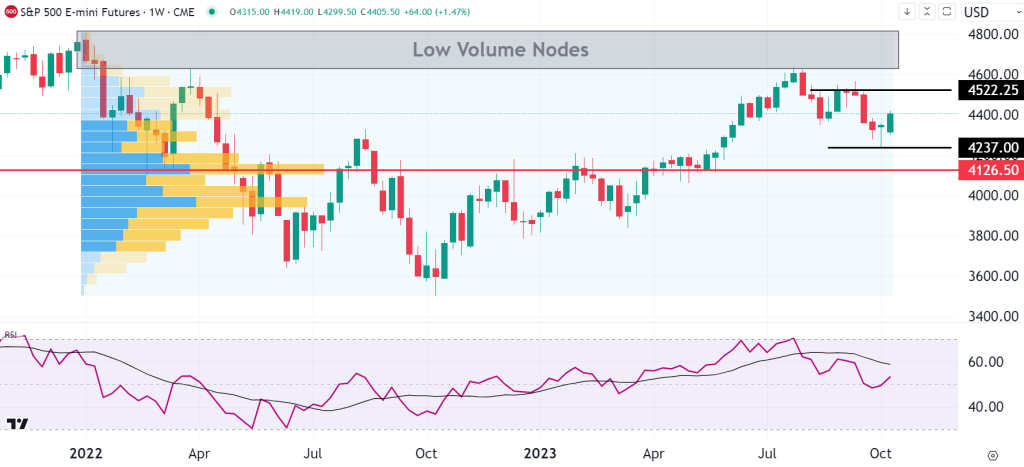
The volume profile indicator shows that above $4,600 there is less liquidity signaled by the low-volume nodes. This means we could see price accelerate at that level. The bulls need to push it there first, though.
The RSI hit overbought levels back in July and after retracing to the 50 line, it has begun to bounce.
Levels To Watch
$4237 is the low of the morning star candlestick formation, which bulls need to see price remain above for sentiment to be in their favor. If prices break below this level, the most immediate bearish target is $4126.50, which is the point of control for the volume profile when measured from the high last year to the current day.
$4522.50 is the first bullish target before prices approach the low volume nodes above.
Over sentiment seems to be shifting to bullish but please traders remember to stick to your plan and solid risk management rules. Read our article on risk management here.
Are You Bullish Or Bearish On ES? Use This 15% Code To Start Trading ARTI15
