

Introduction
estimated reading time: 4 min
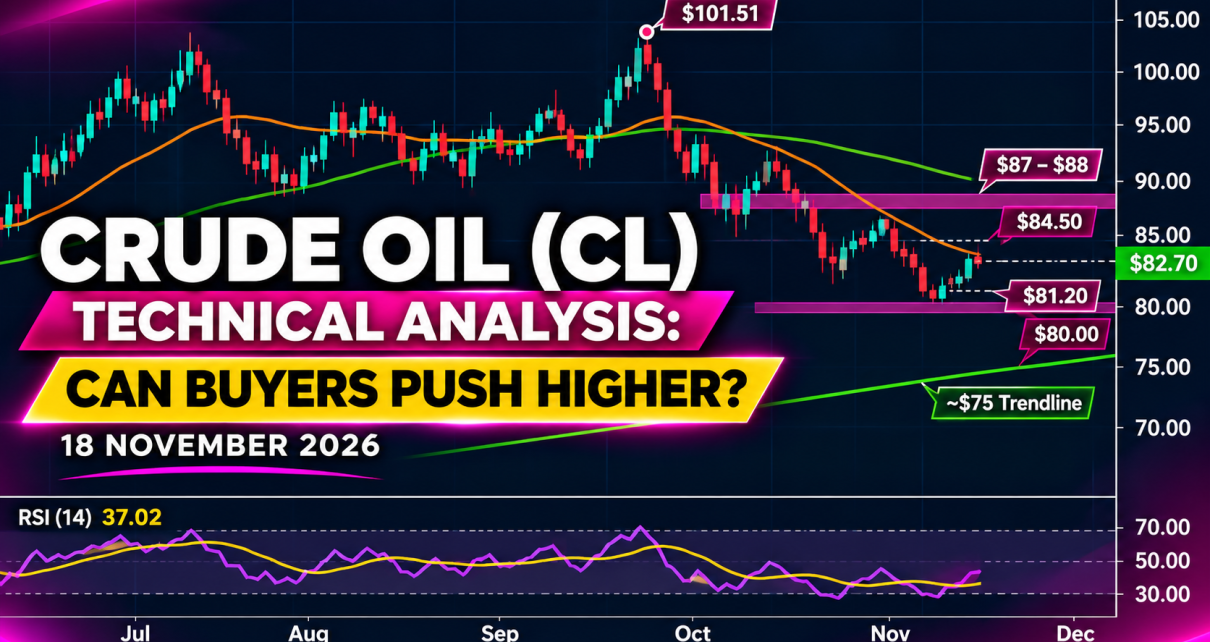
The $94.50 area we were watching in our November 3 crude oil analysis did not hold. Since then, each meaningful bounce has run into sellers at a lower price. Even the strongest recovery last week stalled near $88, and by November 18, WTI crude oil futures (CL) were trading close to $81 a barrel.
Buyers have since lifted CL back to $82.70. The question now is whether they can do something they haven’t managed on the last few attempts: break above a recent hourly high and hold that level on the next pullback.
What does the daily chart tell us?
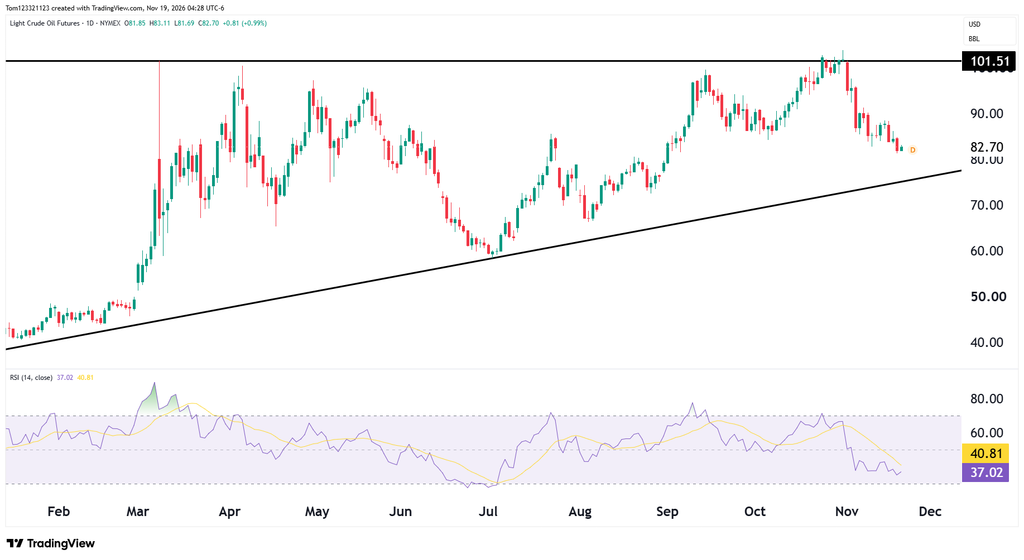
The clearest feature on the daily chart is the rejection at $101.51. Crude briefly traded above that level around the turn of the month, but buyers couldn’t hold the breakout. Price then fell through the October lows in the mid-$80s. An area where buyers had stepped in on the way up is now one they’ll need to reclaim on the way back.
The longer-term picture is less bearish. The rising trendline drawn through the July low is still intact, although it currently runs near $75, well below the market. That distinction matters: the broader pattern leaves room for bulls to recover, but the trendline hasn’t been tested on this decline and doesn’t explain the bounce we’re seeing now.
Daily RSI was 37.02 when the chart was captured, below both its average of 40.81 and the midpoint of 50. Selling pressure has eased enough for price to bounce, but momentum still favors sellers. The November 19 daily candle was also still open.
Is there a long setup on the hourly chart?
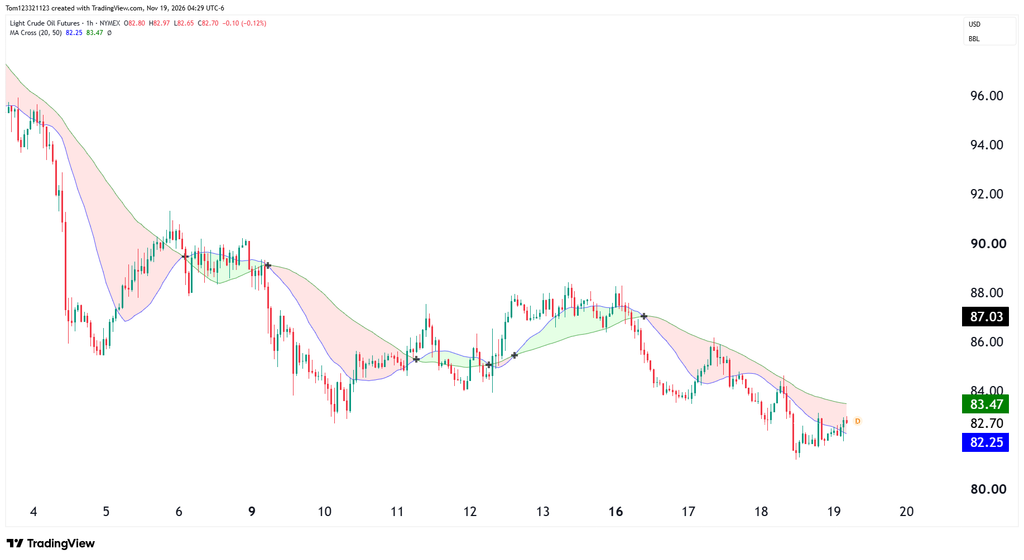
The first encouraging sign for bulls is that CL is back above its 20-hour moving average at $82.25. The harder test is the falling 50-hour average at $83.47. On November 17, a rally toward $86 stalled near that average. The next attempt failed around $84.50, and crude went on to make a fresh low near $81.20.
That makes $83.47–$84.50 the area to watch. A move above the average would be an improvement, but a break above $84.50 followed by a higher low would carry more weight: buyers would finally have cleared the last failed rally. If that happens, $86 is the next test, followed by the cluster of highs around $87–$88.
What if the bounce fails?
A rejection at $83.47 followed by a move back below $82.25 would put the $81.20 low back in play. Below it, $80 is the next round number to watch. It hasn’t yet been tested on this downswing, so there’s no reason to assume buyers will defend it simply because it’s a round number. If crude starts closing below $80 on the daily chart, the rising trendline in the mid-$70s becomes more relevant.
At $82.70, price is sitting between the two hourly averages. For traders considering either side, the next pullback may tell us more than the first green candle: does former resistance hold as support, or do sellers produce another lower high? With recent hourly swings covering several dollars a barrel, it makes sense to identify where the setup fails before deciding on position size.
This analysis is for educational purposes only and does not constitute trading advice. Futures trading involves substantial risk.