- Nasdaq futures struggle to break the 13000 mark.
- Escalating US-China trade tension shrinks investors’ risk sentiment.
- Further Fed tightening may also weigh on the Nasdaq.
On Monday, the E-mini Nasdaq 100 (NQ) futures struggled to break through the 13,000 mark.
Stock futures fell Tuesday morning amid rising tensions between the U.S. and China ahead of House Speaker Nancy Pelosi’s expected visit to Taiwan.
The Dow Jones Industrial Average futures fell 144 points, or 0.5%, while the S&P 500 and Nasdaq 100 futures fell 0.7% and 0.8%, respectively.
According to Reuters, Pelosi will spend Tuesday night in Taiwan. Earlier this year, Chinese officials threatened Pelosi with action if she went ahead with the trip. After Newt Gingrich visited Taiwan in 1997, Pelosi will be the first speaker of the House of Representatives to do so.
Traders also expect a further increase in profits from companies such as Starbucks, PayPal, Caterpillar, and Advanced Micro Devices.
As we concentrate on other catalysts, the economy continues to weaken, increasing recession risks and complicating the outlook for cyclical commodities and equities. As confirmed by the recent ISM manufacturing data, manufacturing growth slowed in July at the slowest pace in two years.
Manufacturing accounts for about 12% of US production, so weaker performance is concerning. The ISM review for July showed a bright spot regarding GDP. It was the fourth-largest drop on record for the price indicator of materials used in manufacturing. Lower manufacturing costs could push CPI down in the coming months, allowing the Federal Reserve to be less hawkish.
Nasdaq 100 (NQ) futures technical analysis:
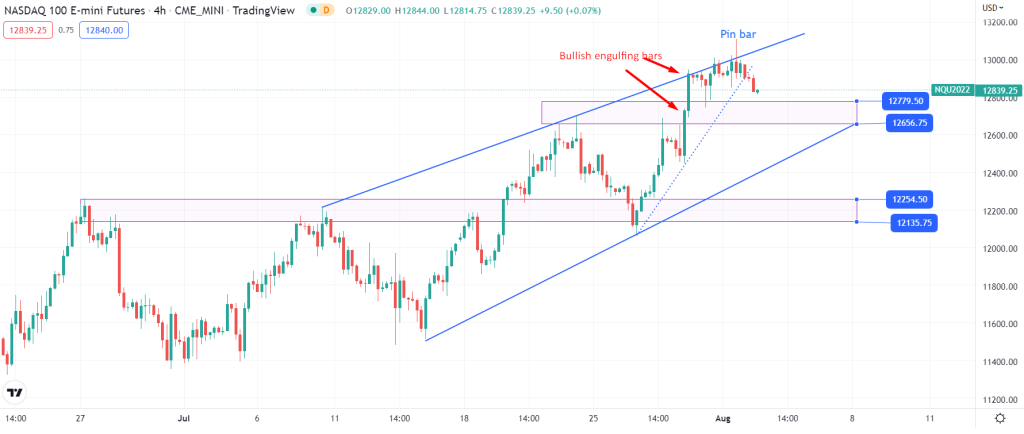
Technically, the Nasdaq futures remain under pressure after the index failed to find acceptance above the 13,000 mark. On the 4-hour chart, you can see a bearish pin bar pattern indicating bearish momentum.
In addition, the index has broken down the trendline (dotted line) and is now moving towards the demand zone (12779.50 – 12656.75). The zone looks strong enough and could slow down the bearish momentum. However, the probability of the price falling below the demand zone cannot be ruled out. The upper trend line of the rising wedge pattern could also provide some resistance if the price decides to move up.
The index is expected to face some tug of war between buyers and sellers around these levels. The two consecutive bullish candles (bullish engulfing bars) indicate some buying strength, hence a choppy price action is expected inside of the rising wedge. The next demand zone – 12254.50 – 12135.75, is another strong support region for the index. This zone will likely provide a decent opportunity for the traders to trade the pullbacks.