


Introduction
The support zone we looked at in our 30 October analysis has given way. We were watching for an hourly reversal around 7,600–7,680, but the selling has pushed ES below that area and out of its ascending channel.
Bulls are now trying to recover, with price trading around 7,459.75 after finding buyers near the 200 day moving average at 7,358. The bounce is encouraging, but can it develop into something more, or will the old support zone attract sellers on the way back up?
S&P 500 technical analysis
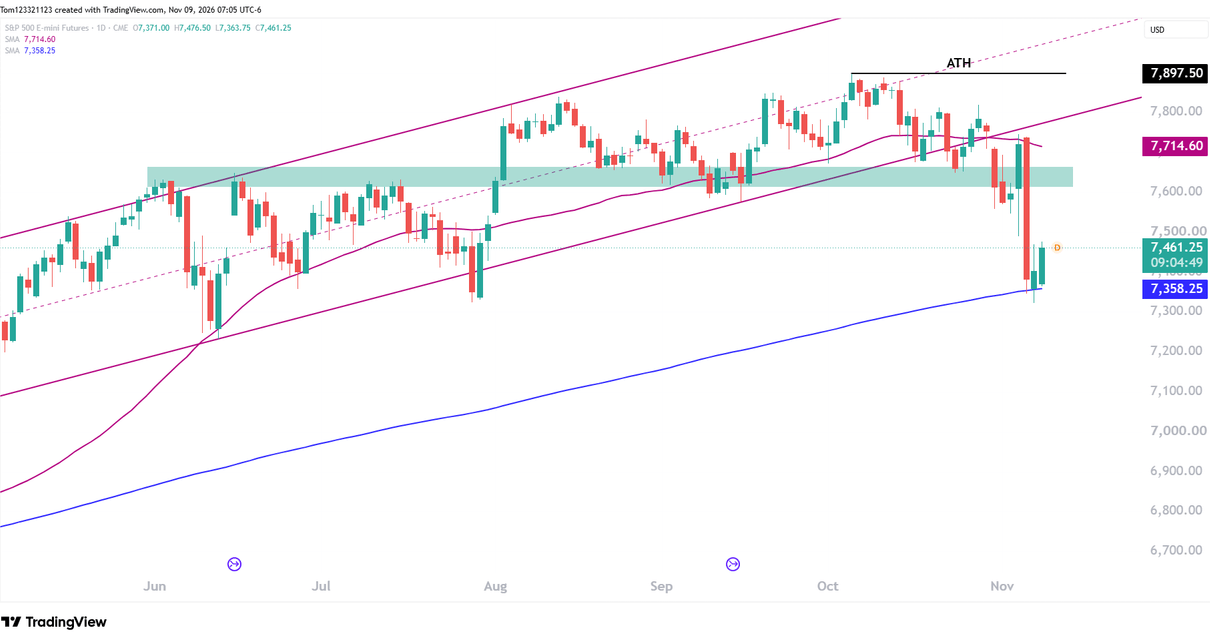
The biggest change on the chart is the break below the ascending channel. That channel had been the main feature of the bullish trend for much of 2026, but the latest selloff has left ES well beneath it, and now the 200-day MA is the level that bulls will try to defend. They have been successful once so far.
The horizontal support zone around 7,600–7,660 has also been lost. This area has seen several reactions since June, making it an important level to watch if the recovery continues. Buyers who previously defended it may now face sellers using the bounce to exit positions.
For the bulls, the strongest feature is the reaction around the blue moving average at 7,358.24. Price briefly traded below it before recovering, and today’s green candle is extending that bounce. The daily candle is still open, so holding those gains into the close would strengthen the recovery case.
Where could ES go next?
7,500 is the first round-number hurdle, followed by the former support zone at 7,600–7,660. A move back above that zone would improve the outlook and bring the magenta moving average near 7,715 into focus. The broken channel boundary would remain another obstacle overhead.
If the recovery stalls and price falls back below 7,358, the recent low area around 7,300–7,320 becomes important. A break beneath it would undermine the current bounce and bring the June lows around 7,250 back into view.
Possible ES trades
Long trade: For traders looking for the bounce to continue, an hourly pullback that forms a higher low above the rising moving average could provide a setup. A break above the preceding hourly swing high would offer confirmation, with stops below the pullback low and potential targets at 7,500 and then 7,600. A break below the recent daily low would invalidate the broader recovery setup.
Short trade: For traders viewing this as a retracement in a falling market, watch for an hourly reversal inside the 7,600–7,660 zone. Stops can sit above the rejection high, with potential targets at 7,500 and then the rising moving average. A sustained recovery above the zone would weaken that short setup.
Disclaimer: Educational content only; no personalized investment recommendation is intended. Futures carry substantial loss risk. Examples are hypothetical, and stop orders cannot guarantee an execution price.