NASDAQ Chart Overview
In this chart, we’re looking at the NASDAQ 100 E-mini Futures (10-minute intervals) along with the Simple Moving Average (SMA), Relative Strength Index (RSI), and Volume Profile Visible Range (VPVR) indicators.
Price Action and Technical Patterns
Channel and Breakout Analysis
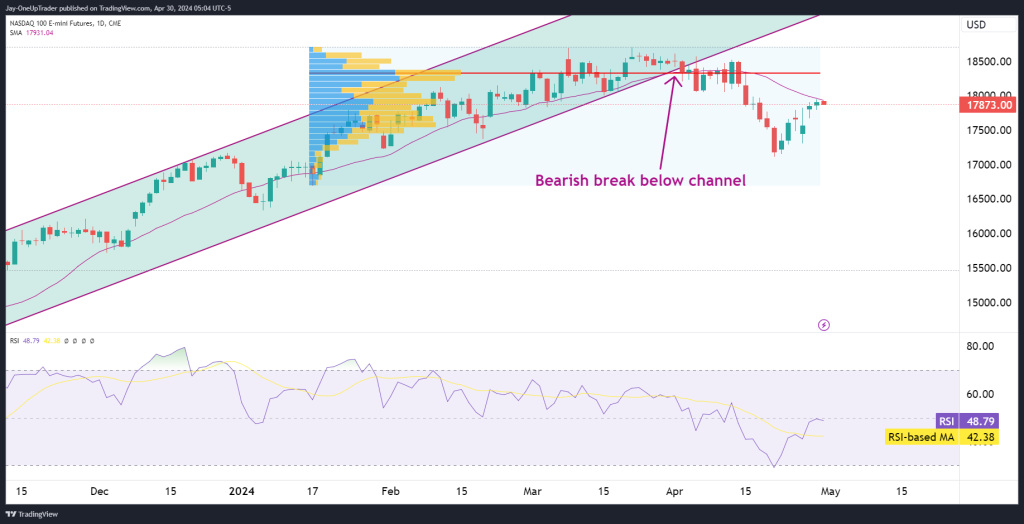
We can see that the price was trading within an ascending channel, which tells us that there was a bullish trend. However, we recently noticed a bearish break below this channel. When the price drops below the channel like this, it can either lead to a consolidation phase where we see price trade sideways for a while or a complete trend reversal.
SMA Analysis
We can see that the 50-period SMA is at the current price of ES which is already showing signs of resistance. If the price can’t break above the SMA, it could confirm that the bearish trend is continuing.
Volume Profile (VPVR)
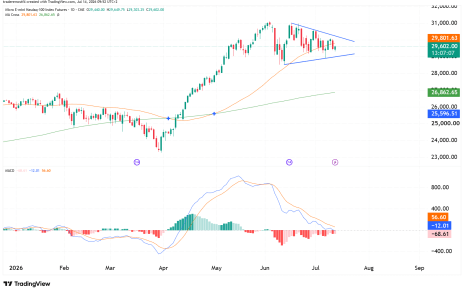
The VPVR shows that there was a lot of trading activity at higher price levels compared to where the price is now. These areas could act as resistance if the price tries to recover. The point of control (highest volume node) near these levels suggests strong interest, and it might take a lot of buying pressure to overcome this.
Momentum Indicators
- RSI Analysis: The RSI is at 48.79, which is close to the neutral 50 level. However, it’s showing some bearish momentum because the RSI line is below its moving average (42.38). This tells us that there isn’t strong buying or selling pressure right now, but the bearish trend could continue if the RSI moves further below 50.
Sentiment and Future Outlook
- Short-term (Days to Weeks): We have a bearish outlook, based on the break below the support channel and the RSI’s position. We should watch for a possible retest of the channel from below, which could serve as new resistance.
- Medium-term (Weeks to Months): The outlook is uncertain, and we could see further downside if the SMA and VPVR resistance levels hold. However, if the price recovers above these levels, it could mean that the bearish outlook is no longer valid.
- Long-term (Months): This depends on broader market conditions and the macroeconomic picture.
Key Considerations
- As traders, we should keep an eye out for any bullish signals or reversal patterns near the current levels, as these might indicate a potential short-term buying opportunity.
- We need to stay aware of broader market sentiment and news that could impact the index’s performance.
- It’s important to watch for a sustained move below the SMA and further declines in the RSI, as these would confirm bearish momentum.