

- Gold’s 2023 performance is up 30% from November lows to April highs.
- Triple top formation on the chart, indicating potential resistance.
- Death cross observed on the daily chart, requiring monitoring for bearish trends.
Intorduction
Gold has been an exciting asset to watch in 2023 as there have been periods where it has followed the Dollar, which it generally should diverge from. The yellow metal was up 30% at a stage from its lows made in November of last year to the recent highs made in April, but there is something very important on the chart that we need to monitor, and it’s the triple top formation.
The danger of a triple top
The weekly chart is a scary one to look at for long-term bulls. There is heavy resistance at the all-time high level at $2,080. It is going to take a lot to push through this level. The Dollar will have to fall significantly, and there will likely be a lot of uncertainty in the marketplace for this to occur.
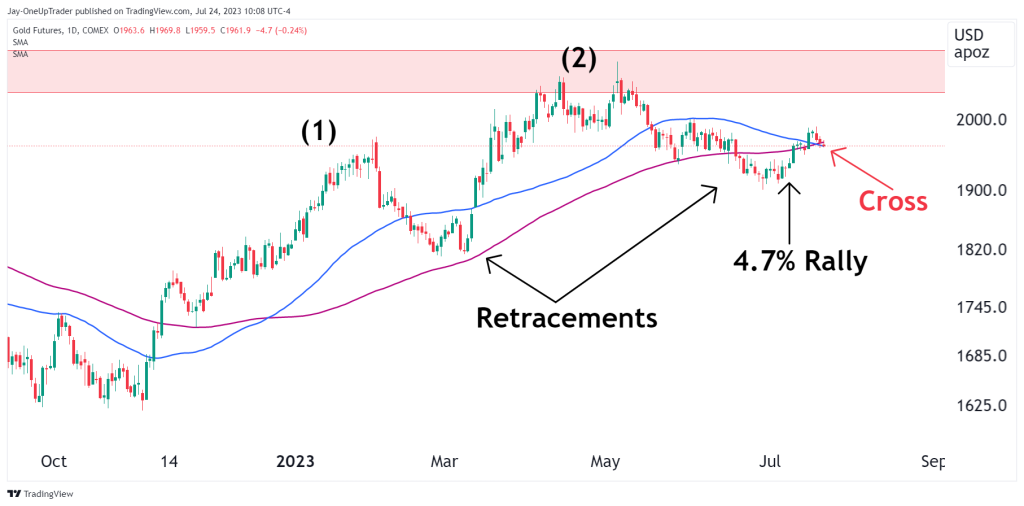
Daily Chart
The daily chart looks like a normal bullish trend with two impulse waves and two retracements. There is a death cross, though, as the 50-moving average has crossed below the 100. We do see this at times, and the trend continues shortly after, so it may not be anything to worry about right now for the bulls. We will need to wait and see once price tests higher prices again if the bulls are able to push price higher. There is a small attempt that has lasted the last week to push prices higher as Gold rallied 4.7% from its recent low.
Ending off
Gold is the most interesting chart to look at as far as I am concerned at the moment. The triple top on the weekly but the uptrend on the daily chart gives us a lot to watch out for. Make sure to think in probabilities and not chase the market in either direction. Everything will hinge on what the Dollar does, so I would keep a close eye on Fed policy and economic data while trading GC.
